The Exceptions Dashboard summarizes any deviations from standard procedures or
unexpected findings encountered during rounds execution. It highlights anomalies or
exceptions that require attention, ensuring they are addressed promptly. For example, faulty
equipment, identified safety hazards, deviations from process protocols, or missing data
points during monitoring. This report serves as a critical tool for identifying and managing
issues that could impact operational efficiency, safety, or compliance.
To view the Exceptions Dashboard:
Expand the Operator Rounds module and click
Exceptions Dashboard on the left-side pane.
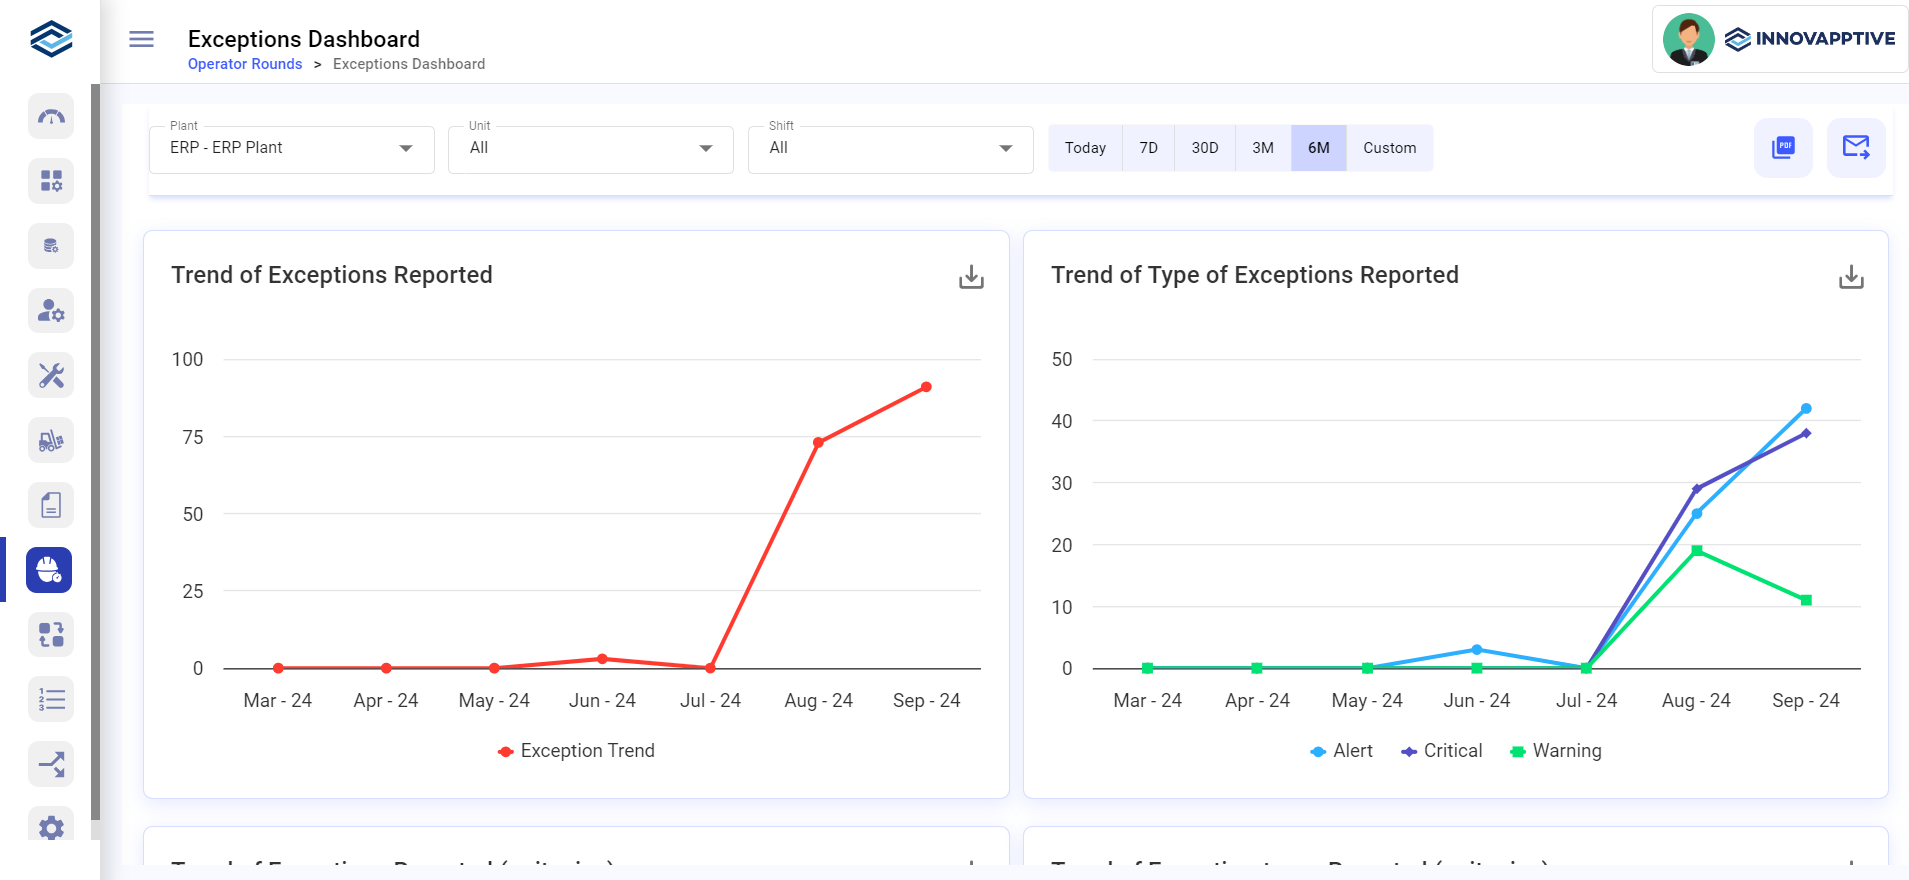
The Exceptions Dashboard screen is displayed with different types of
widgets.
Figure 1. Exceptions Dashboard
In this screen you can,
Filter the reports based on Plant, Unit, Shift, Today, 7 Days, 30
Days, 3 Months, 6 Months, and Custom.
Click the PDF icon on top-right to download the Exceptions Dashboard
in PDF format.
Click the Email icon on the top-right corner to share the dashboard
through email.
Click the Download icon on the report widget to save the report in
image format.
Click the values on the graph to view them in detail and
download.