View Measuring Documents in Graphical Mode
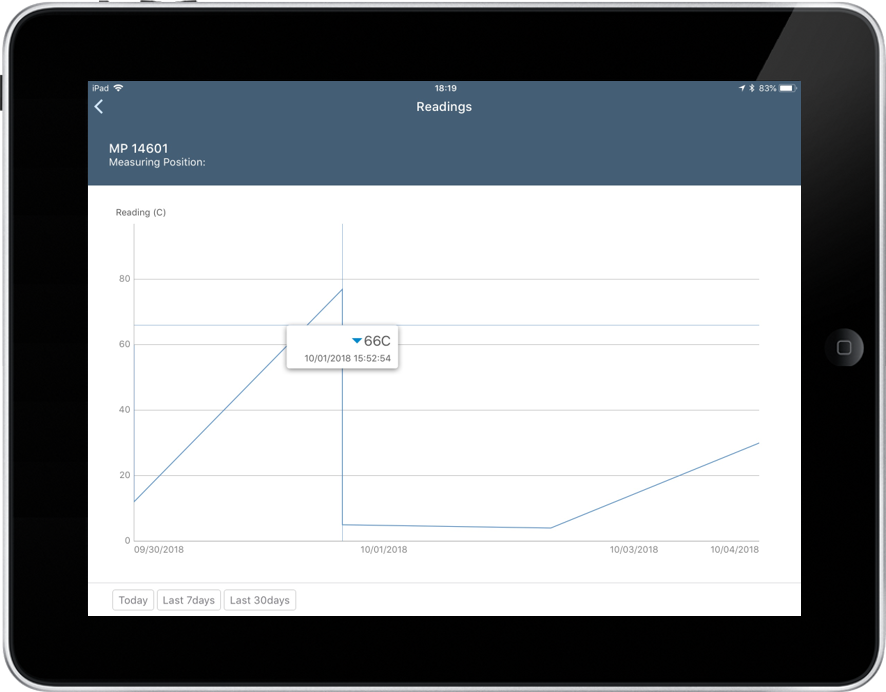
You can view the Measuring Documents in a graphical representation and by tapping the line chart on the graph, you can view the measurement readings at any instance.
The X-axis represents the Hours/Days/Month and the Y-axis represents the measurement readings along with units. You can also filter the measurement readings on daily, weekly, and monthly basis.
Note: By default, the measurement readings appear in day view on the UI.
Graphical representation of Measuring Documents is available in both Online and Offline modes.