Configure Custom Reports for Improved Monitoring
Leverage the Configure Data Parameters feature to create tailored reports for monitoring task completion, compliance, equipment performance, and more. By customizing data points, supervisors can generate meaningful insights and visualize them in widgets to improve decision-making and operational efficiency.
Learn how to configure custom data parameters for generating insightful reports. Supervisors can track key metrics like task completion rates, equipment performance, and issues raised during maintenance rounds. These reports can be displayed in widgets for easy monitoring.
For instance, you can create a report to track control valve inspections and monitor on-time completion rates over the past month. By customizing fields such as operator performance or task status, you can focus on areas that require attention.
To create a report:
-
Expand the Operator Rounds module and click
Reports on the left-side pane.
The Reports screen is displayed.In this screen, you can,
Figure 1. Reports Screen 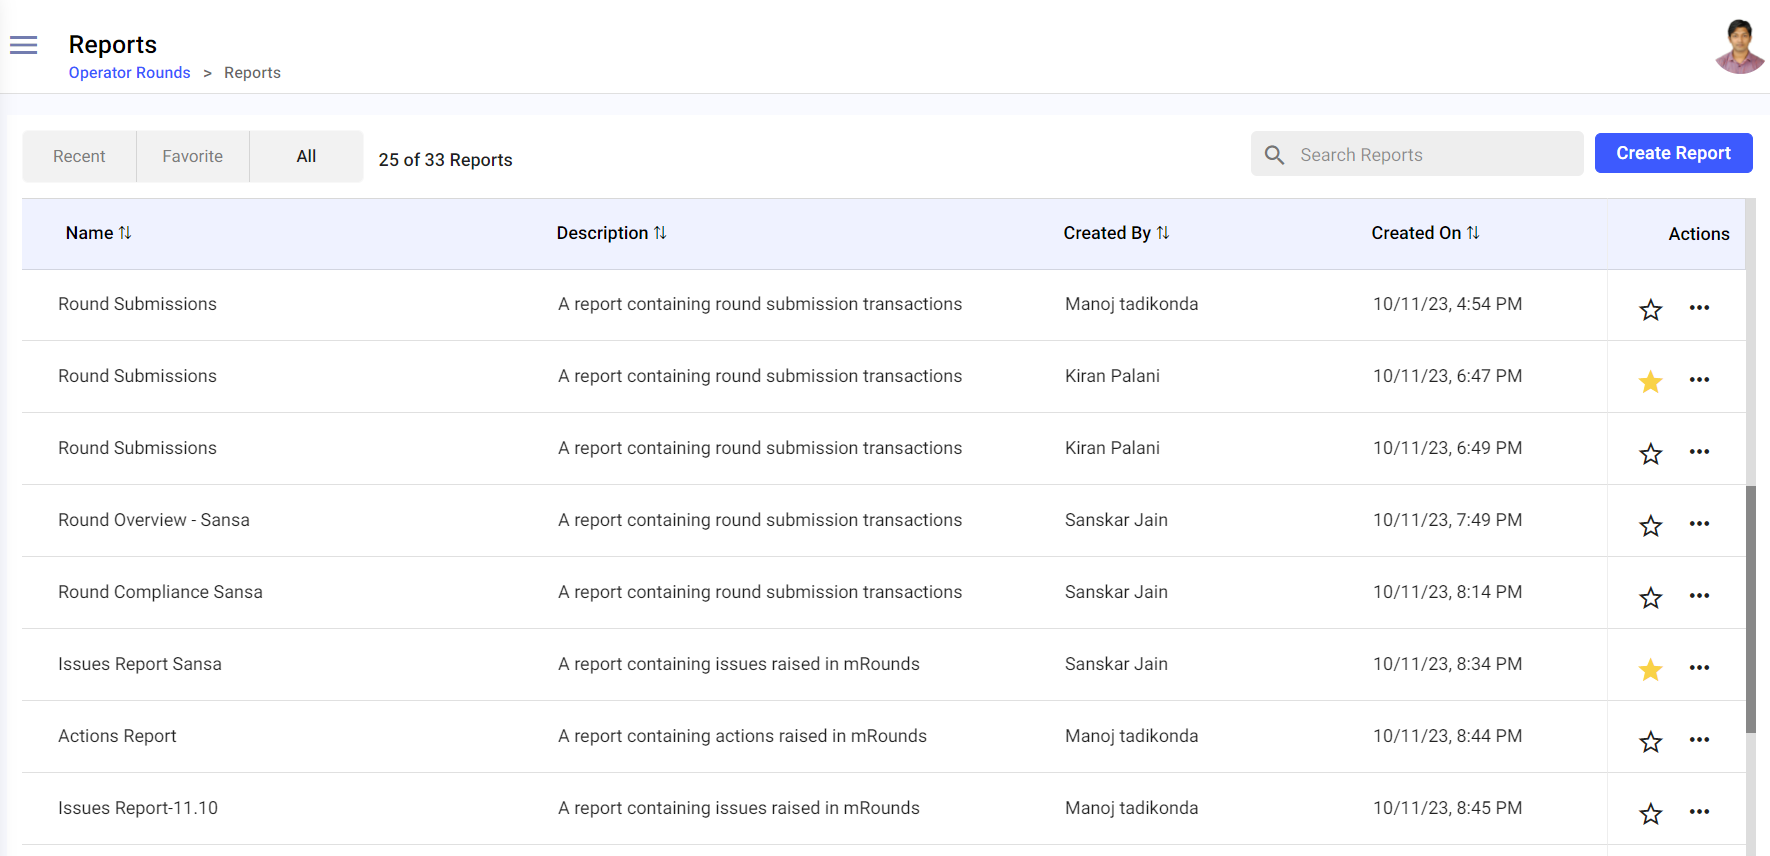
- Filter and view the reports based on Recent, Favorite, and All options.
- Search the reports using the Search Reports bar.
- Click the Sort
 icon next to the columns to sort the
columns.
icon next to the columns to sort the
columns. - Click the Favorite
 icon to mark the report favorite.
 - Click the More
 icon > Preview
option to view the preview of the report.
icon > Preview
option to view the preview of the report. - Click the More icon > Edit option
to edit the report.
- Click the More icon > Export to
Excel option to download or export the report in excel
format.
- Click the More icon > Copy option
to copy the report.
- Click the More icon > Delete option
to delete the report.
- In the Reports screen, click the Create Report button on the right-side.
-
In the Report Configuration window,
Figure 2. Report Configuration Window 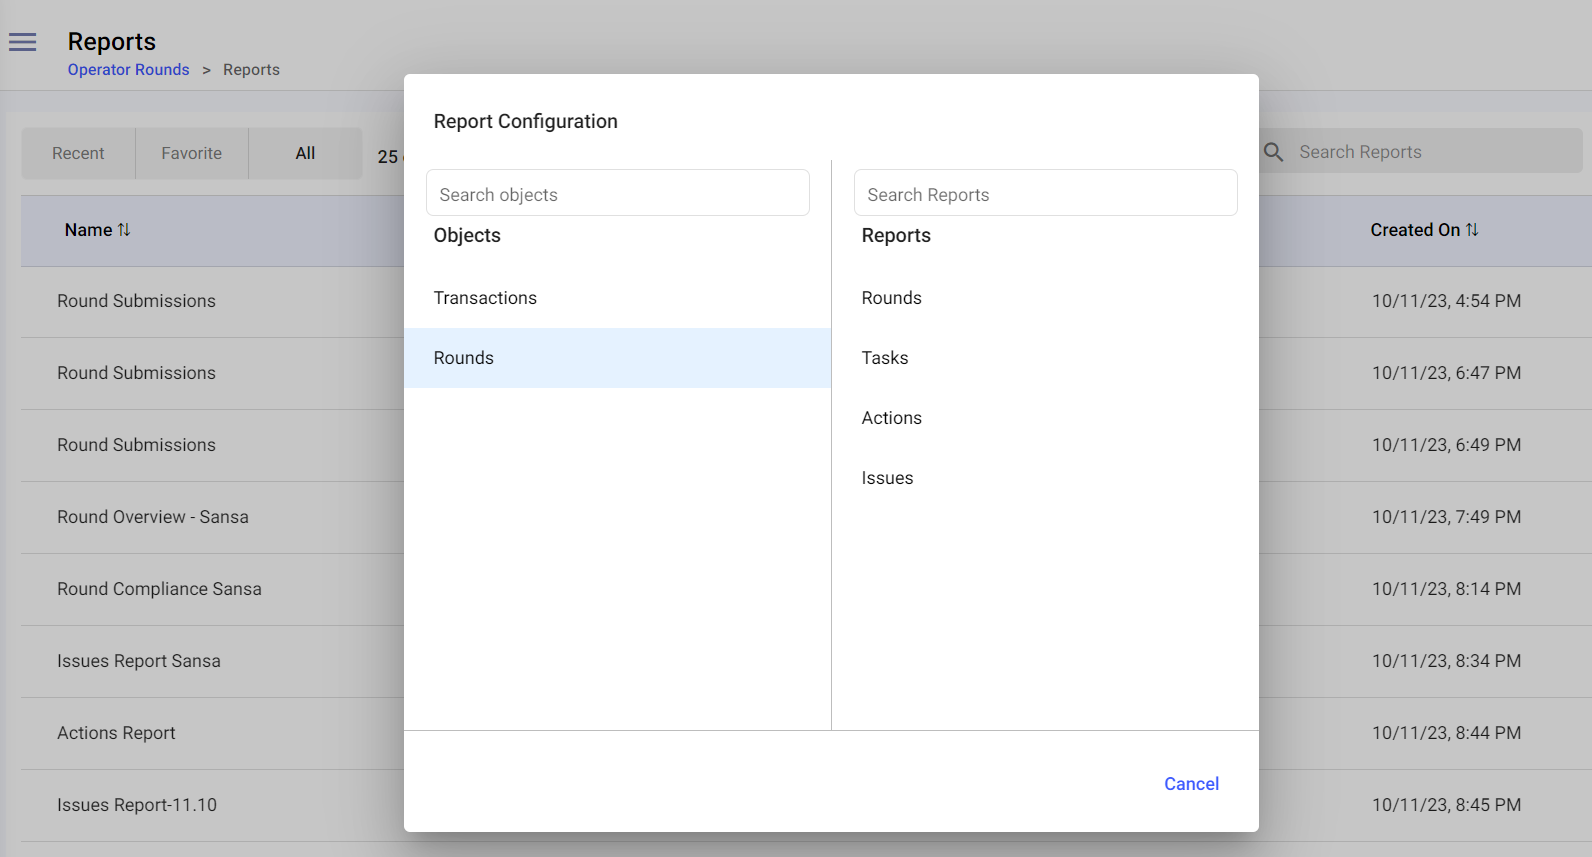
- Select the Objects such as Transactions or Rounds on the left side.
- Select the Reports such as Rounds, Tasks, Actions, or Issues on the right side.
Figure 3. Create Report 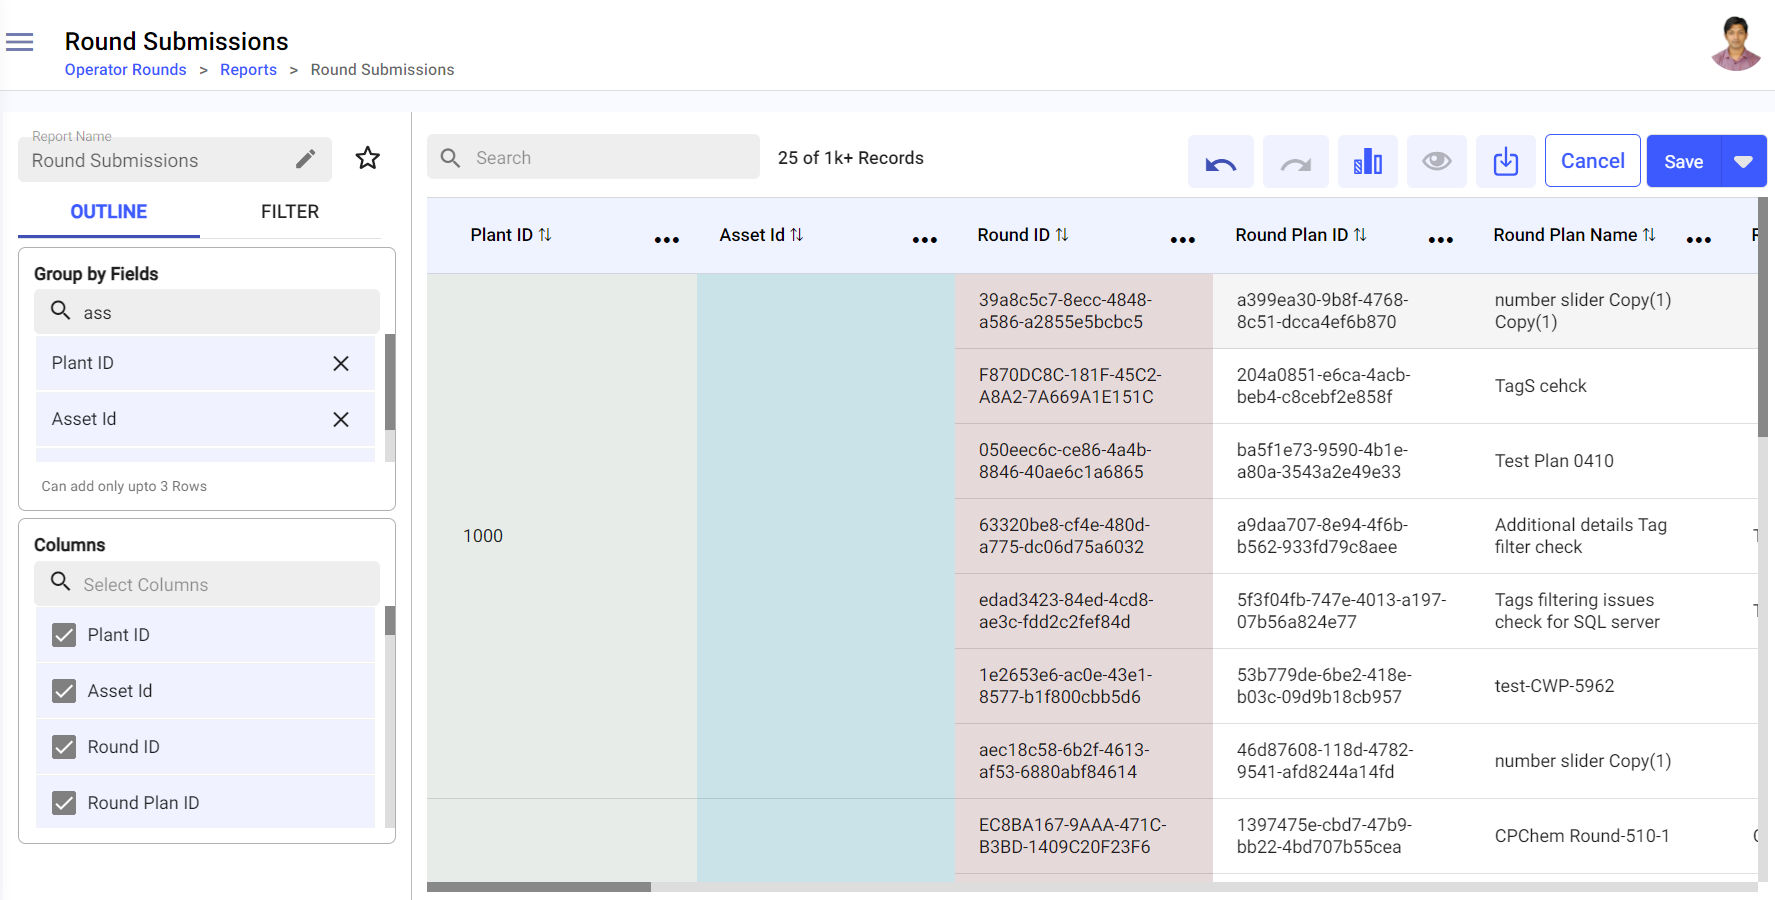
- In the Report Name field, click the Edit icon to update the title of the report, if needed.
- In the Group by Fields field, select the value or column to group the data by the selected value or column in the report. For example, Plant ID.
- In the Columns field, select the required columns to display them in the report.
-
Click Save or Save As on the top
right to save the report with a different name.
The report is saved successfully and you can see it in the Reports screen.In the Create Report screen, you can,
- Click the Favorite icon next to the Report
Name field to mark the report favorite.
- Search the columns using the Search bar.
- Filter or query the report based on Date, Plant, Unit, Shift, Asset
or Location, Round Details, etc. Follow the below steps to
filter.
- Click the Filter tab on the left-side section.
- Click Add Filter and select the value from the list. For example, RoundPlan ID, Plant Name, Shift Name, Slot Time, Location Name, Asset ID, or Task ID, etc.
- Click on the selected value.
- In the Filter by <value> pop-up, select a value from the Operator drop-down such as equals, not equal to, less than, greater than, less or equal, greater or equal, contains, does not contain, or starts with, enter a value and click Save.
- The filtered or queried report is displayed on the right-side and you can download it.
Note: Filter doesn’t apply to the bar chart. - Click the Undo
 or Redo
  icons to undo or redo the actions that you have performed.
 - Click the Bar Graph
 icon to view the data in the widget
format.
icon to view the data in the widget
format.- Click the Settings icon to change the variants or styles of the widget and the values. For more information, see Create Interactive Reports in Custom Widgets.
- Click the Restore icon to refresh the data in the widget.
- Click the Save as Image icon to save the widget as image.
Figure 4. Bar-chart Details 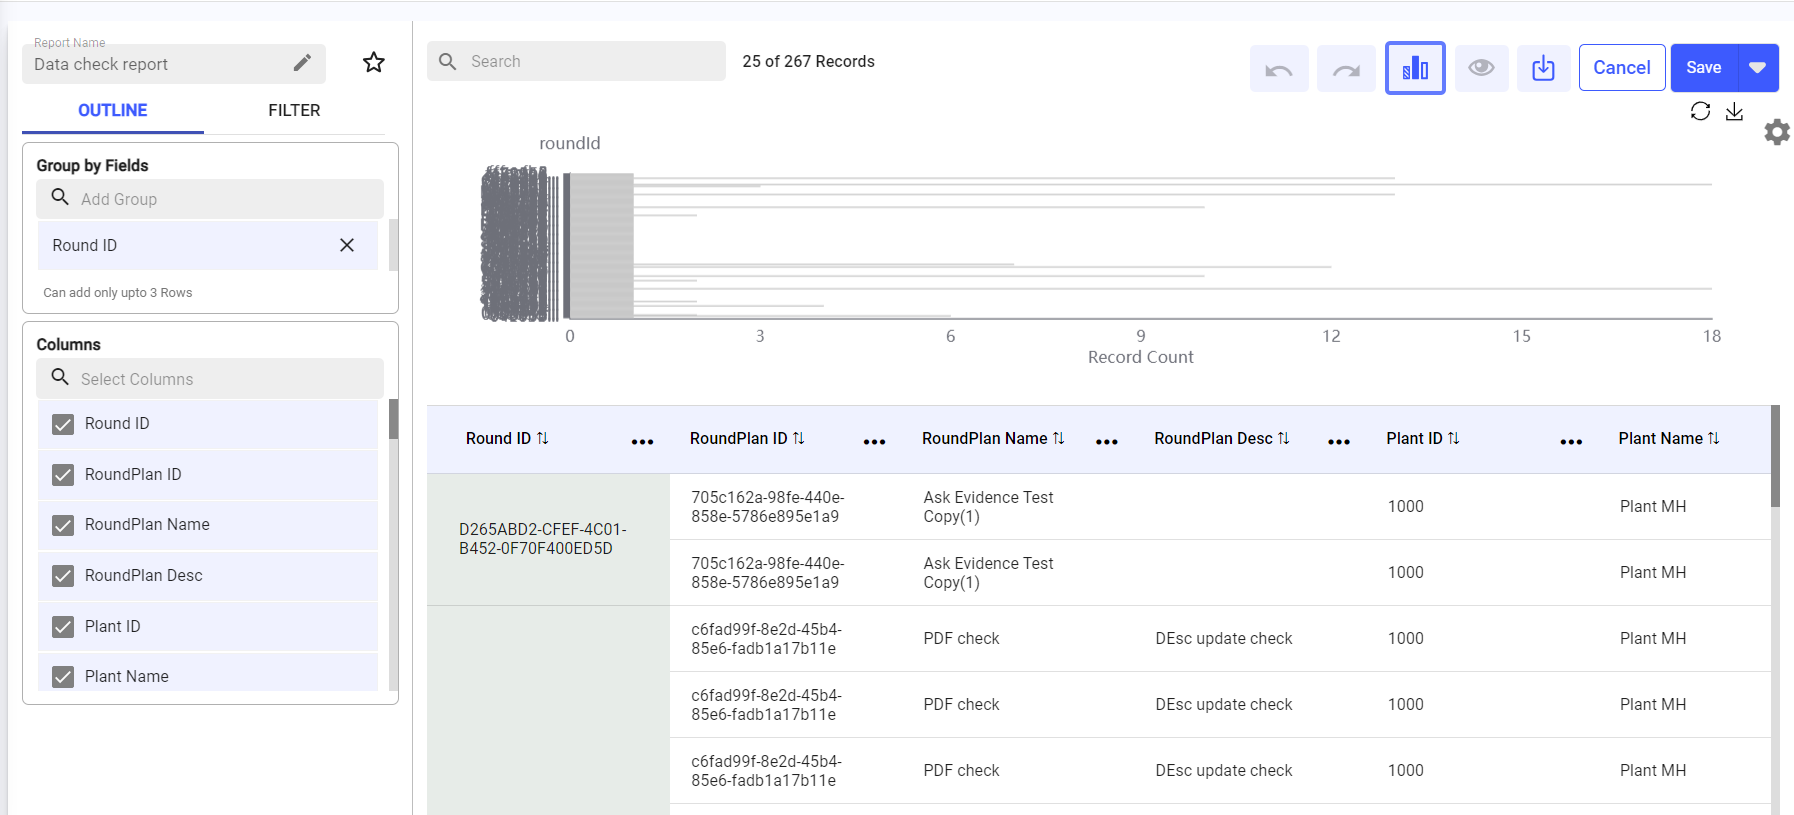
- Click the Preview
 icon to view the preview of the
report.
icon to view the preview of the
report. - Click the Download
 icon to download or export the report
into csv or excel format.
icon to download or export the report
into csv or excel format. - Click the Sort icon to sort the columns in the
table.
- Click the More icon > Hide
Column, Move Left,
Move Right, Stick,
to Group Rows by this Column next to the
columns to hide, move left, move right, stick, and group the
columns.
- Click the Favorite