The Compliance Dashboard tracks adherence to company policies, regulatory
requirements, and standard operating procedures. It provides insights into completed vs.
overdue inspections, safety checks, and audit compliance, ensuring that teams meet required
standards..
Supervisors can use this dashboard to monitor compliance trends, identify gaps, and
take proactive measures to mitigate risks. By centralizing compliance data, this
dashboard helps organizations maintain accountability and avoid potential penalties
or safety hazards.
To view compliance reports:
Expand the Operator Rounds module and click
Compliance Dashboard on the left-side pane.
The information in the Compliance Dashboard is categorized under the
following sections.
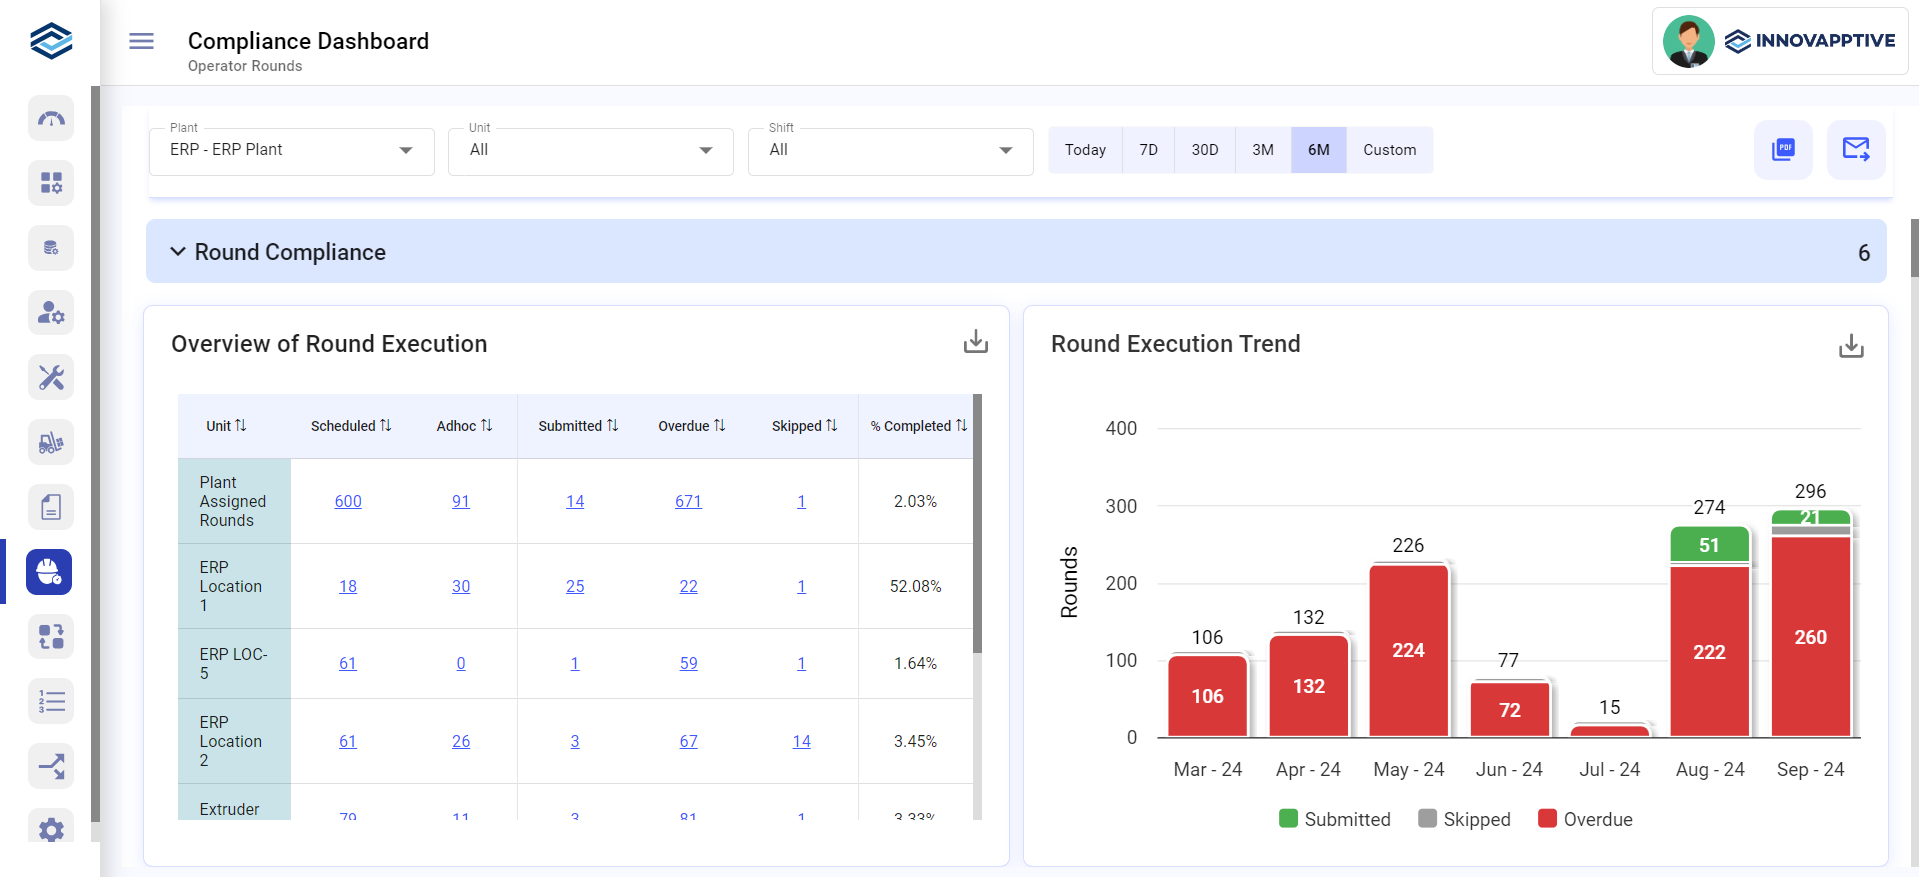
Round Compliance: This section visually represents the
percentage of completed versus incomplete rounds, based on the
status of each round. It helps supervisors quickly assess adherence
to scheduled rounds and identify any missed or incomplete
tasks.
Scan Compliance: This section summarizes any scan overrides
that occurred during operator rounds. It highlights instances where
operators manually bypassed scanning requirements, providing insight
into deviations from standard procedures.
Time Compliance: This section displays the expected versus
actual duration of rounds, providing a summary that highlights any
discrepancies. It helps ensure rounds are completed within the
designated timeframes for optimal efficiency.
Issues / Actions Compliance: This section displays the number
of issues and actions raised during rounds execution, comparing
those created versus those resolved. It helps monitor the resolution
process, ensuring timely action and compliance with operational
standards.
Figure 1. Compliance Dashboard
In this screen you can,
Filter the reports based on Plant, Unit, Shift, Today, 7 Days, 30
Days, 3 Months, 6 Months, and Custom.
Click the PDF icon on top-right to download the Compliance Dashboard
in PDF format.
Click the Email icon on the top-right corner to share the dashboard
through email.
Click the Download icon on the report widget to save the report in
image format.
Click the values on the graph to view them in detail and
download.