Create Custom Widgets
Widgets offer a dynamic way to visualize key data through charts, tables, and more. They help monitor task progress, track equipment status, and highlight critical issues in real-time, enabling better decision-making and proactive maintenance.
Learn how to create custom widgets that visually present essential reports and metrics. Using configurable data parameters, you can showcase various report types, such as task completion, compliance metrics, and equipment health. These widgets provide actionable insights for identifying trends, monitoring performance, and staying compliant with maintenance schedules.
For example, you can generate a widget that shows the percentage of completed maintenance tasks, allowing you to prioritize critical operations.
To create a widget:
- Expand the Operator Rounds module and click Custom Dashboard on the left-side pane.
-
In the Custom Dashboard screen, click Create
Widget on top-right.
Figure 1. Create Widget 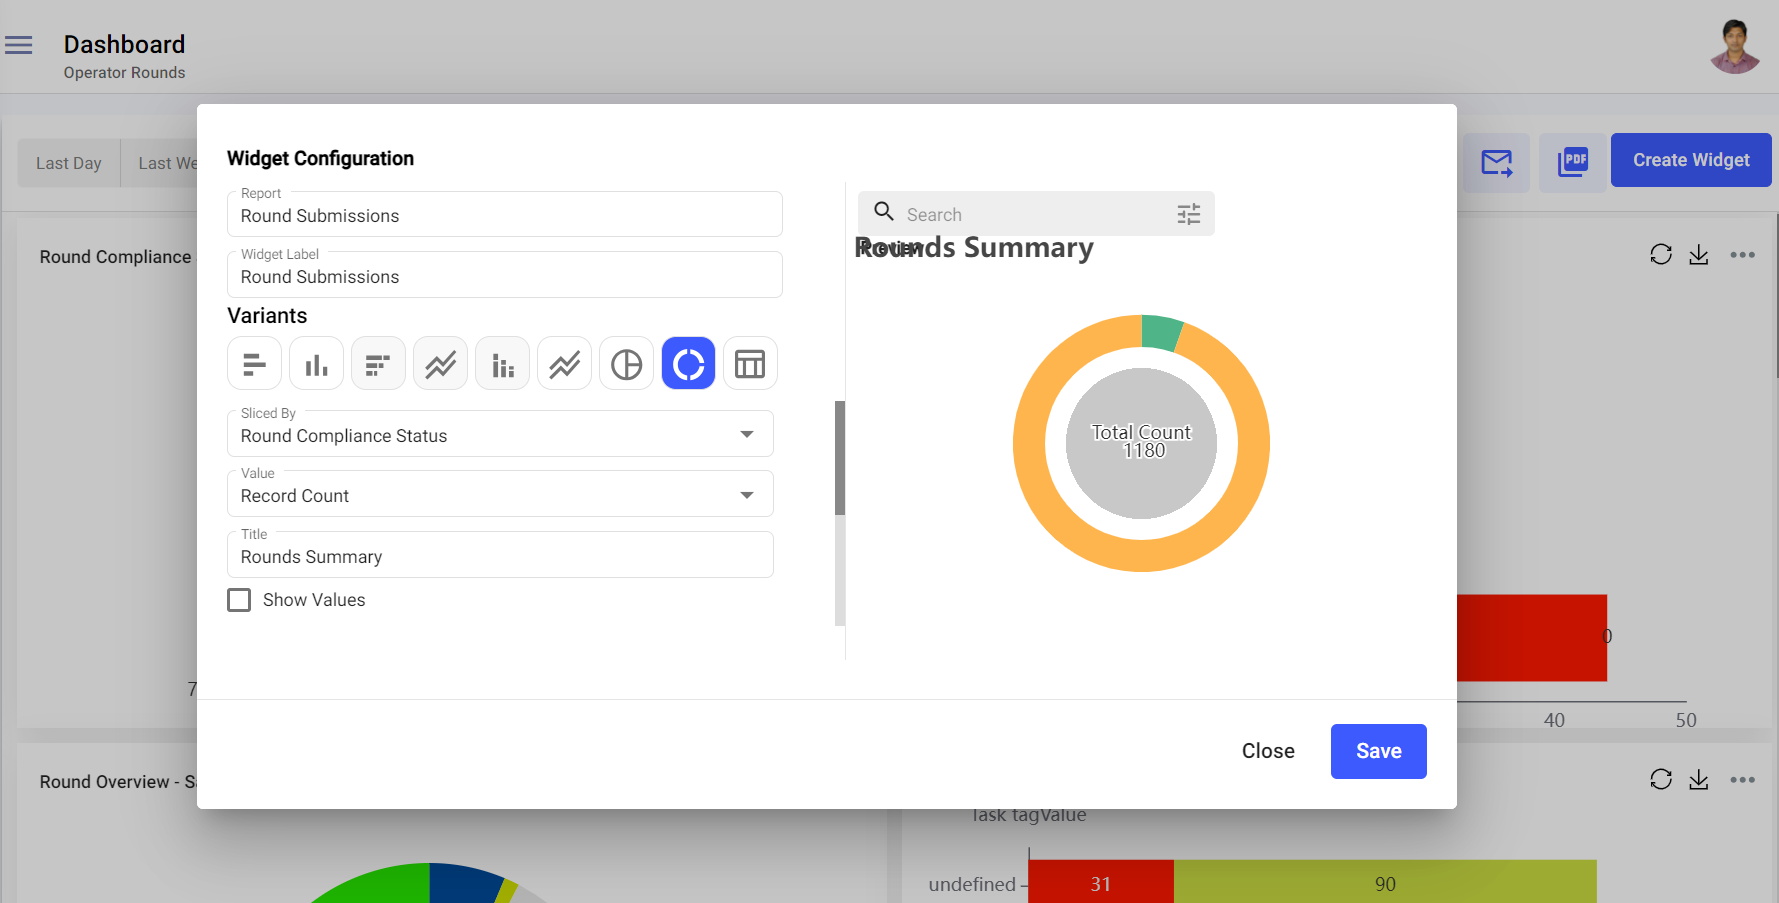
-
In the Widget Configuration window,
- Select the report from the Report list.Note:To select the report, the report should be created earlier. For more information, see Create and Share Transactions and Rounds Reports.
- Enter the report name in the Widget Label field. Form example, such as Maintenance Rounds Monitoring.
- Select the variants like Column Chart, Bar Chart, Horizontal Stacked Chart, Multiline Chart, Vertical Stacked Chart, Area Chart, Pie Chart, Donut Chart, or Tabular from the Variants section.
- Select the Group by Fields and Columns, X axis
and Y axis, Stack By, or
Sliced By and Value
values.Note:The above values appear based on the selected variant.
- Select color for the legends.
- Enter the title of the widget in the Title field.
- Select the Show Values checkbox to display the values for the transactions.
- Select the Show Legends checkbox to display the legend.
-
Note:If you want to show the particular transaction from the report in the widget (for example, transactions done by operators), perform the below steps:
- Click the Filter icon on the right side.
- In the Filter pop up, select the column value in the Add Filter field (for e.g., Role).
- Click the column value (for e.g., Role).
- In the Filter by pop up, select the filter value (for e.g., Operator).
- Click Save.
- Click Apply.
- Now the widget displays the values for the selected transaction.
- Click the Reset button to clear the filter and display all the values.
- Click Save.
In the Dashboard screen, you can,- Filter reports based on Last Day, Last Week, Last Month, Last 3 Months, Last 6 Months, or Custom.
- Filter reports based on Plant or Shift.
- Click the Restore
 icon to refresh the data in the
widget.
icon to refresh the data in the
widget. - Click the Save as Image
 icon to save the widget as an image.
 - Click the More
 icon and select Edit
to edit the widget.
icon and select Edit
to edit the widget. - Click the More icon and select Copy
to copy the widget.
- Click the More icon and select
Delete to delete the widget.
- Resize the widgets.
- Drag and drop widgets and change location.
- Click on the widget to see and download or export the detailed report in Excel format.
- Select the legend value in the widget to hide it from the widget (works only for Pie and Doughnut variants).
- Select the report from the Report list.