How to create a Report
Create different types of reports like rounds, tasks, actions, and issues to show a comprehensive overview of Task Compliance, Rounds Summary, Task Exceptions based on the rounds execution.
To create a report:
-
Expand the Operator Rounds module and click Reports on the
left-side pane.
The Reports screen is displayed.In this screen, you can,
Figure 1. Reports Screen 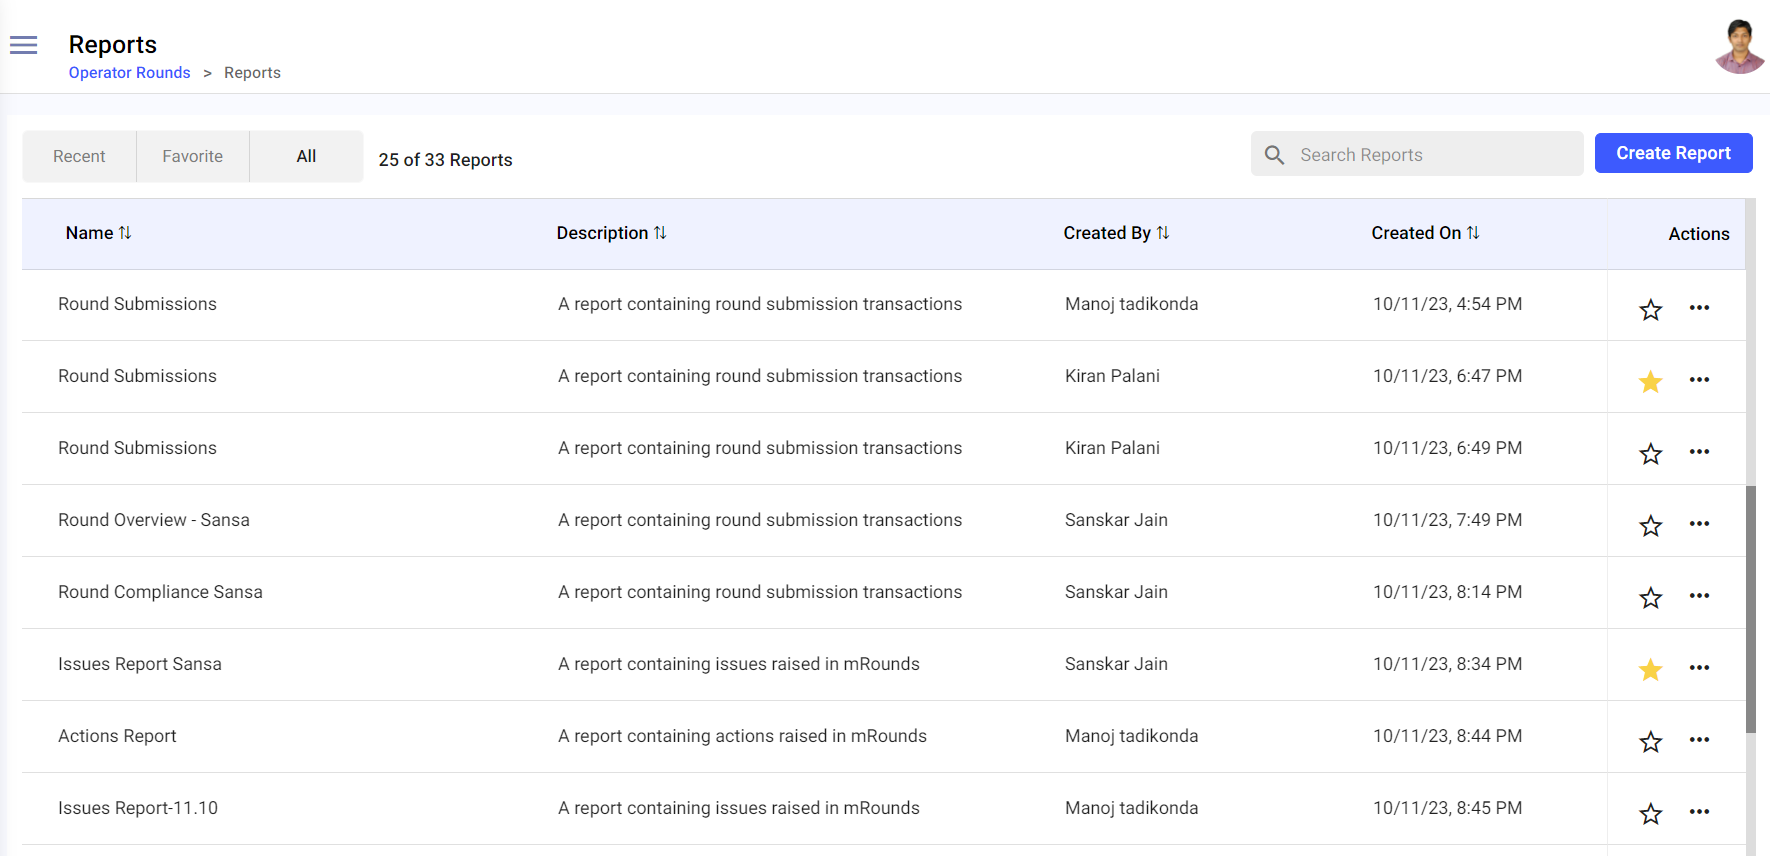
- Filter and view the reports based on Recent, Favorite, and All options.
- Search the reports using the Search Reports bar.
- Click the Sort
 icon next to the columns to sort the
columns.
icon next to the columns to sort the
columns. - Click the Favorite
 icon to mark the report favorite.
 - Click the More
 icon > Preview option to view the
preview of the report.
icon > Preview option to view the
preview of the report. - Click the More icon > Edit option to edit the
report.
- Click the More icon > Export to Excel option to
download or export the report in excel format.
- Click the More icon > Copy option to copy the
report.
- Click the More icon > Delete option to delete the
report.
- In the Reports screen, click the Create Report button on the right-side.
-
In the Report Configuration window,
Figure 2. Report Configuration Window 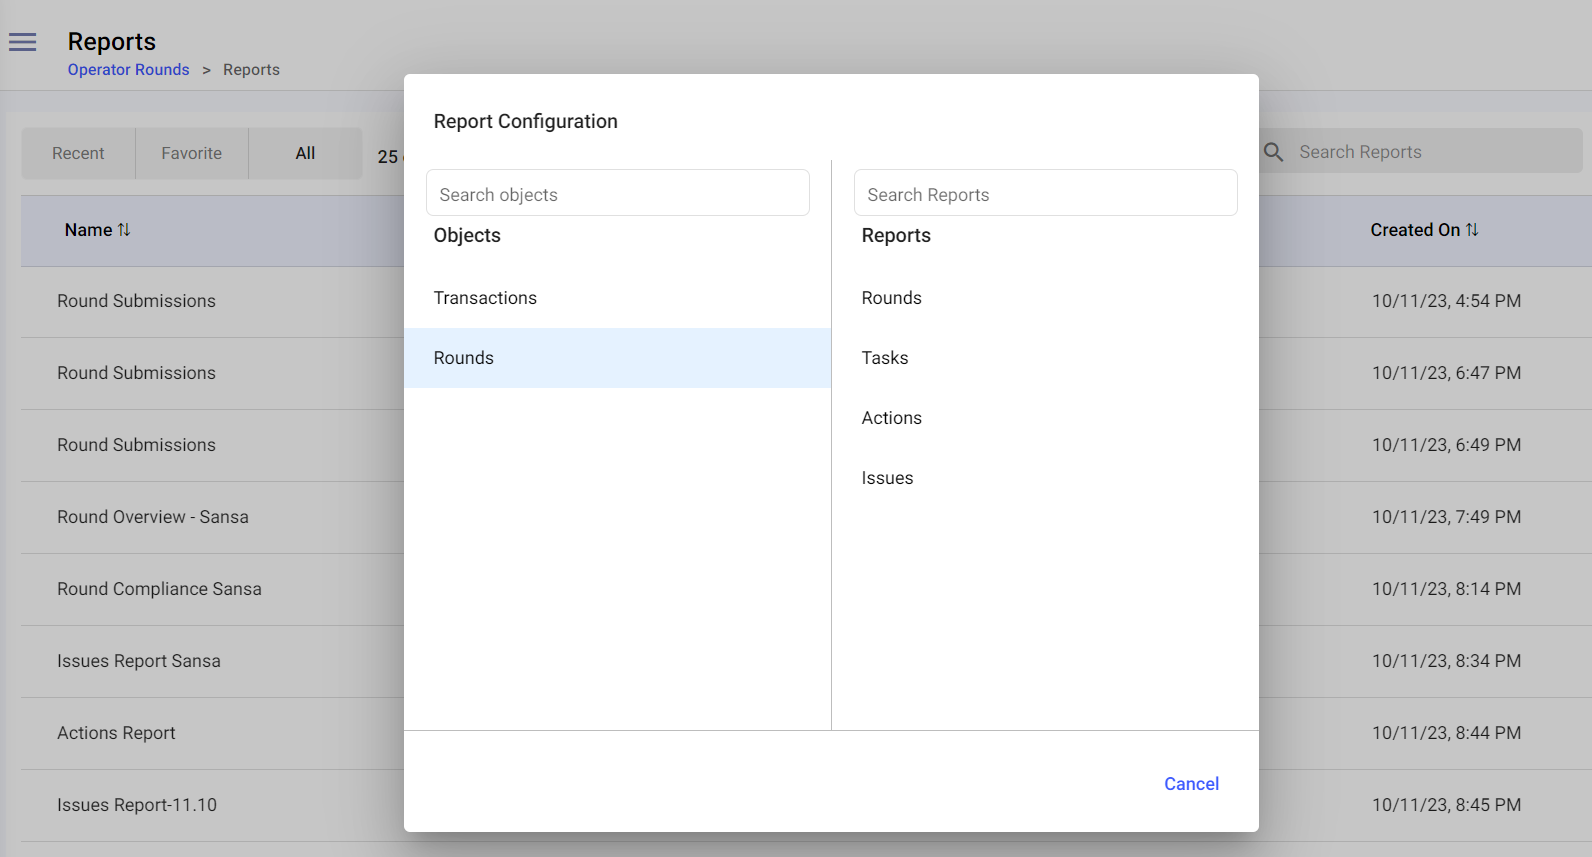
- Select the Objects such as Transactions or Rounds on the left side.
- Select the Reports such as Rounds, Tasks, Actions, or Issues on the right side.
Figure 3. Create Report 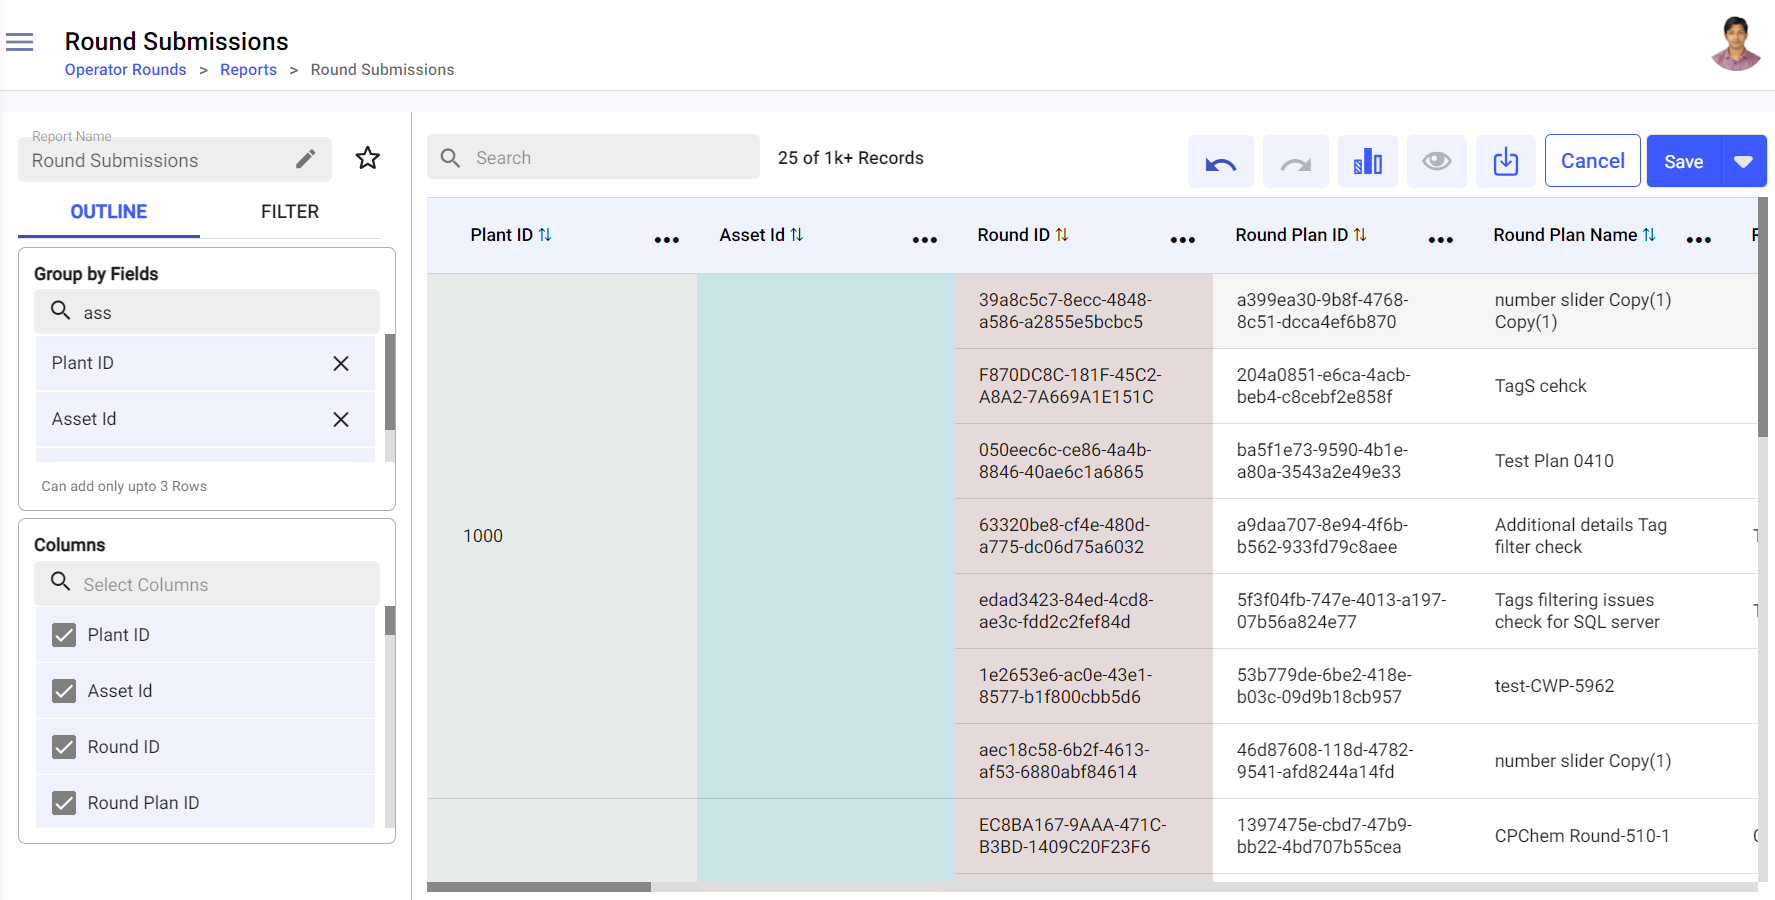
- In the Report Name field, click the Edit icon to update the title of the report, if needed.
- In the Group by Fields field, select the value or column to group the data by the selected value or column in the report. For example, Plant ID.
- In the Columns field, select the required columns to display them in the report.
-
Click Save or Save As on the top right to save the report with a
different name.
The report is saved successfully and you can see it in the Reports screen.In the Create Report screen, you can,
- Click the Favorite icon next to the Report Name
field to mark the report favorite.
- Search the columns using the Search bar.
- Filter or query the report based on Date, Plant, Unit, Shift, Asset
or Location, Round Details, etc. Follow the below steps to
filter.
- Click the Filter tab on the left-side section.
- Click Add Filter and select the value from the list. For example, RoundPlan ID, Plant Name, Shift Name, Slot Time, Location Name, Asset ID, or Task ID, etc.
- Click on the selected value.
- In the Filter by <value> pop-up, select a value from the Operator drop-down such as equals, not equal to, less than, greater than, less or equal, greater or equal, contains, does not contain, or starts with, enter a value and click Save.
- The filtered or queried report is displayed on the right-side and you can download it.
Note: Filter doesn’t apply to the bar chart. - Click the Undo
 or Redo
  icons to undo or redo the actions that you have performed.
 - Click the Bar Graph
 icon to view the data in the widget
format.
icon to view the data in the widget
format.- Click the Settings icon to change the variants or styles of the widget and the values. For more information, see How to create a Widget.
- Click the Restore icon to refresh the data in the widget.
- Click the Save as Image icon to save the widget as image.
Figure 4. Bar-chart Details 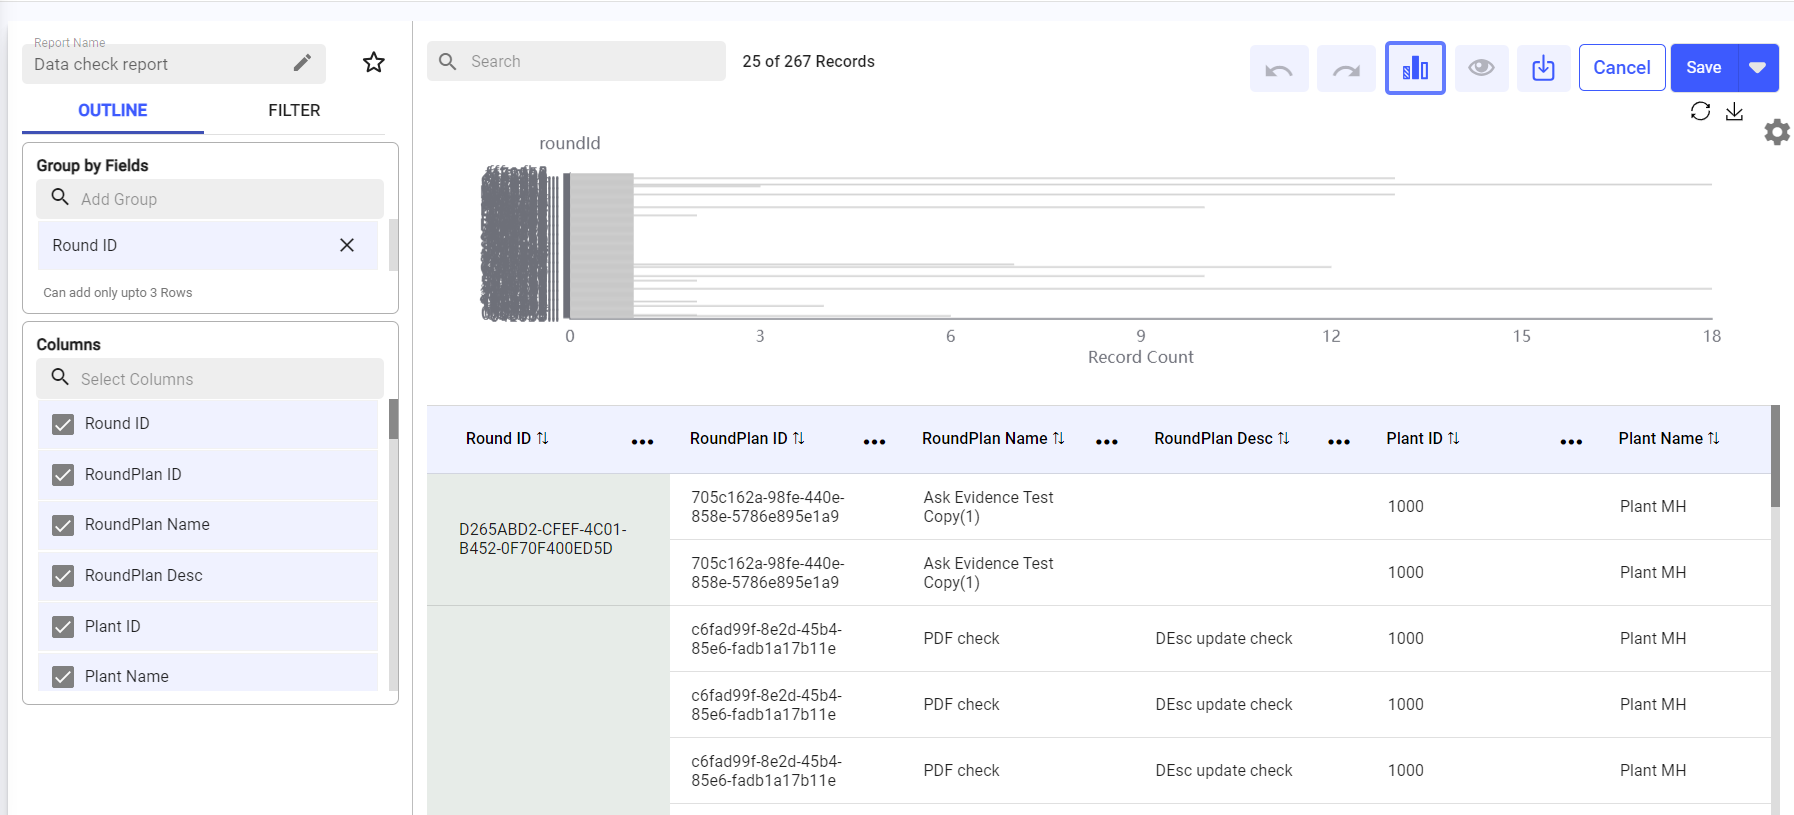
- Click the Preview
 icon to view the preview of the
report.
icon to view the preview of the
report. - Click the Download
 icon to download or export the report
into csv or excel format.
icon to download or export the report
into csv or excel format. - Click the Sort icon to sort the columns in the
table.
- Click the More icon > Hide Column, Move
Left, Move Right, Stick, to Group Rows by
this Column next to the columns to hide, move left, move
right, stick, and group the columns.
- Click the Favorite