How to create a Widget
Configure widgets with various types of reports like round overview, compliance, exceptions, and so on.
To create a widget:
- Expand the Operator Rounds module and click Dashboard on the left-side pane.
-
In the Dashboard screen, click Create Widget on top-right.
Figure 1. Create Widget 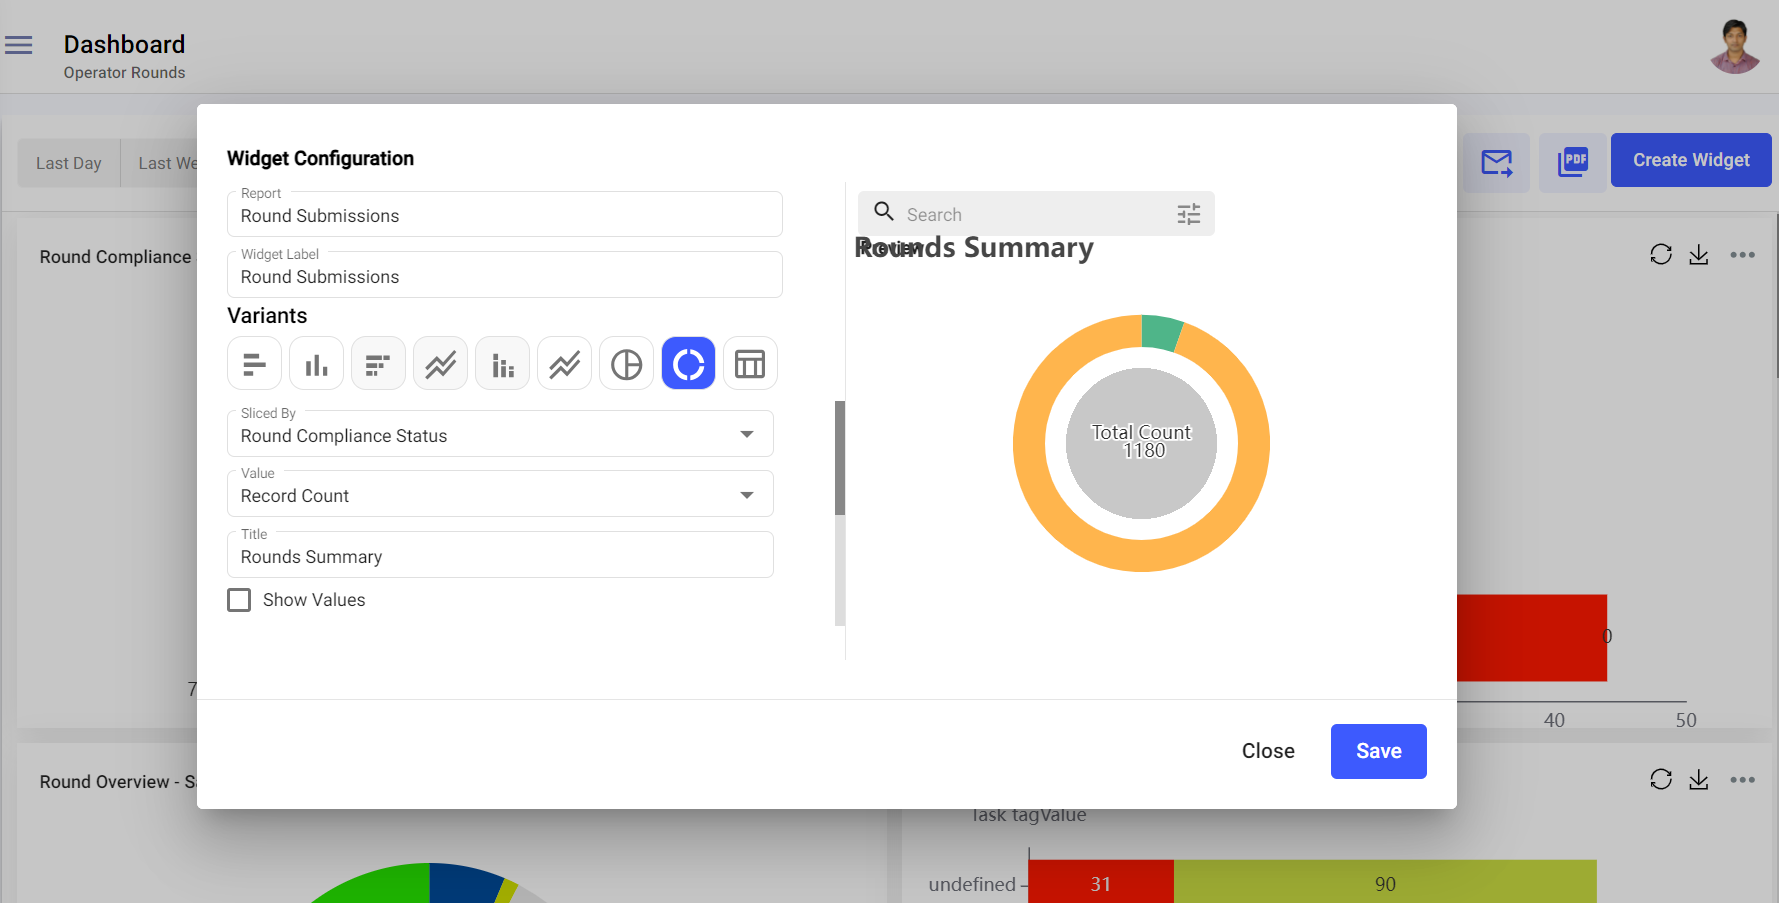
-
In the Widget Configuration window,
- Select the report from the Report list.Note: To select the report, the report should be created earlier. For more information, see How to create a Report.
- Enter the report name in the Widget Label field.
- Select the variants like Column Chart, Bar Chart, Horizontal Stacked Chart, Multiline Chart, Vertical Stacked Chart, Area Chart, Pie Chart, Donut Chart, or Tabular from the Variants section.
- Select the Group by Fields and Columns, X axis and Y axis,
Stack By, or Sliced By and Value values.Note: The above values appear based on the selected variant.
- Select color for the legends.
- Enter the title of the widget in the Title field.
- Select the Show Values check box to display the values for the transactions.
- Select the Show Legends check box to display the legend.Note: If you want to show the particular transaction from the report in the widget (for example, transactions done by operators), perform the below steps:
- Click the Filter icon on the right side.
- In the Filter pop up, select the column value in the Add Filter field (for e.g., Role).
- Click the column value (for e.g., Role).
- In the Filter by pop up, select the filter value (for e.g., Operator).
- Click Save.
- Click Apply.
- Now the widget displays the values for the selected transaction.
- Click the Reset button to clear the filter and display all the values.
- Click Save.
In the Dashboard screen, you can,- Filter reports based on Last Day, Last Week, Last Month, Last 3 Months, Last 6 Months, or Custom.
- Filter reports based on Plant or Shift.
- Click the Undo
 or Redo
  icons to undo or redo the actions that you have performed.
 - Click the Mail
 icon to share the dashboard via Email.
 - Click the PDF
 icon to download the dashboard along with
the widget reports in the PDF format.
icon to download the dashboard along with
the widget reports in the PDF format. - Click the Restore
 icon to refresh the data in the
widget.
icon to refresh the data in the
widget. - Click the Save as Image
 icon to save the widget as image.
 - Click the More
 icon and select Edit to edit the
widget.
icon and select Edit to edit the
widget. - Click the More icon and select Copy to copy the
widget.
- Click the More icon and select Delete to delete the
widget.
- Resize the widgets.
- Drag and drop widgets and change location.
- Click on the widget to see and download or export the detailed report in Excel format.
- Select the legend value in the widget to hide it from the widget (works only for Pie and Doughnut variants).
- Select the report from the Report list.