
Create Custom Widgets
Widgets offer a dynamic way to visualize key data through charts, tables, and more. They help monitor task progress, track equipment status, and highlight critical issues in real-time, enabling better decision-making and proactive maintenance.
Learn how to create custom widgets that visually present essential reports and metrics. Using configurable data parameters, you can showcase various report types, such as task completion, compliance metrics, and equipment health. These widgets provide actionable insights for identifying trends, monitoring performance, and staying compliant with maintenance schedules.
For example, you can generate a widget that shows the percentage of completed maintenance tasks, allowing you to prioritize critical operations.
To create a widget:
- Expand the Operator Rounds module and click Custom Dashboard on the left-side pane.
- Click Custom Dashboard.
- Click on an existing dashboard card to open the dashboard.
- Click Create Widget.
-
Select one of the following based on your requirement from the dropdown:
- Pre-Built (Only Trends) - Used for quick, trend-based visualizations with limited configuration.
- Report - Used to create widgets from existing reports with full chart and layout control.
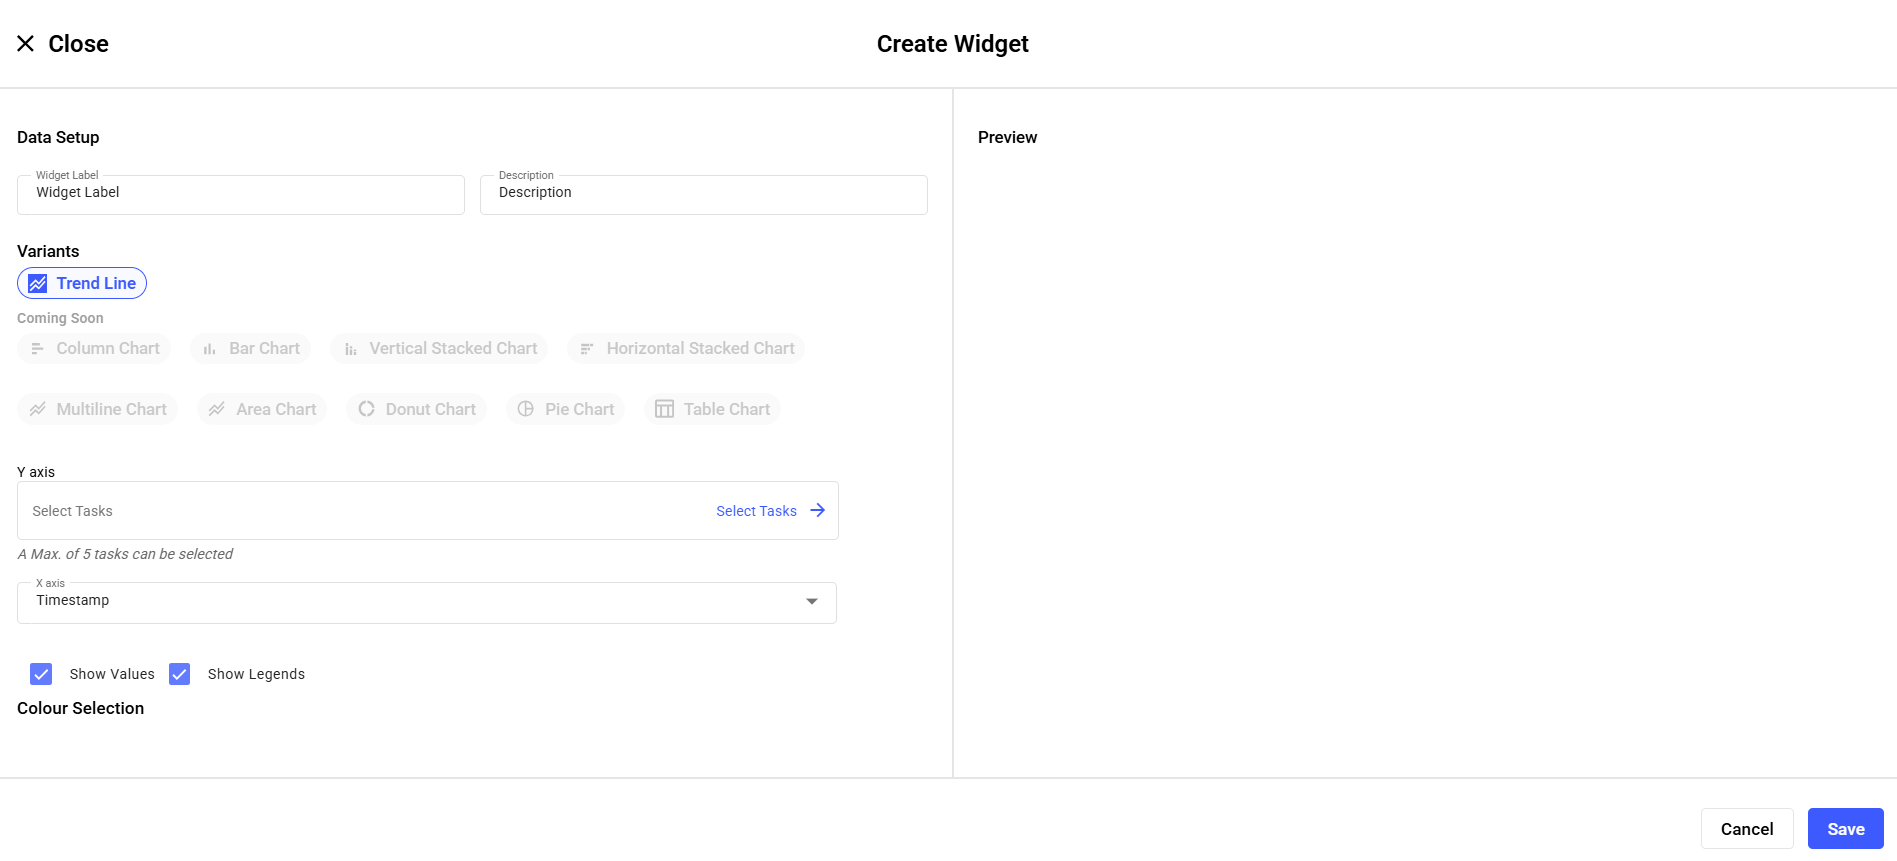
Create Pre-Built (Only Trends) Widget:- Provide below details in Create Widget screen:
- Widget Label
- Description
- Under Variants select Trend Line.
- Configure the axes:
- Y axis: Select up to 5 tasks
- X axis: Timestamp (default)
- Select display options
- Show Values
- Show Legends
- Configure colors under Colour Selection.
- Click Save.
The widget is added to the dashboard and displays trend data for the dashboard’s plant.
Create a Widget from a Report-
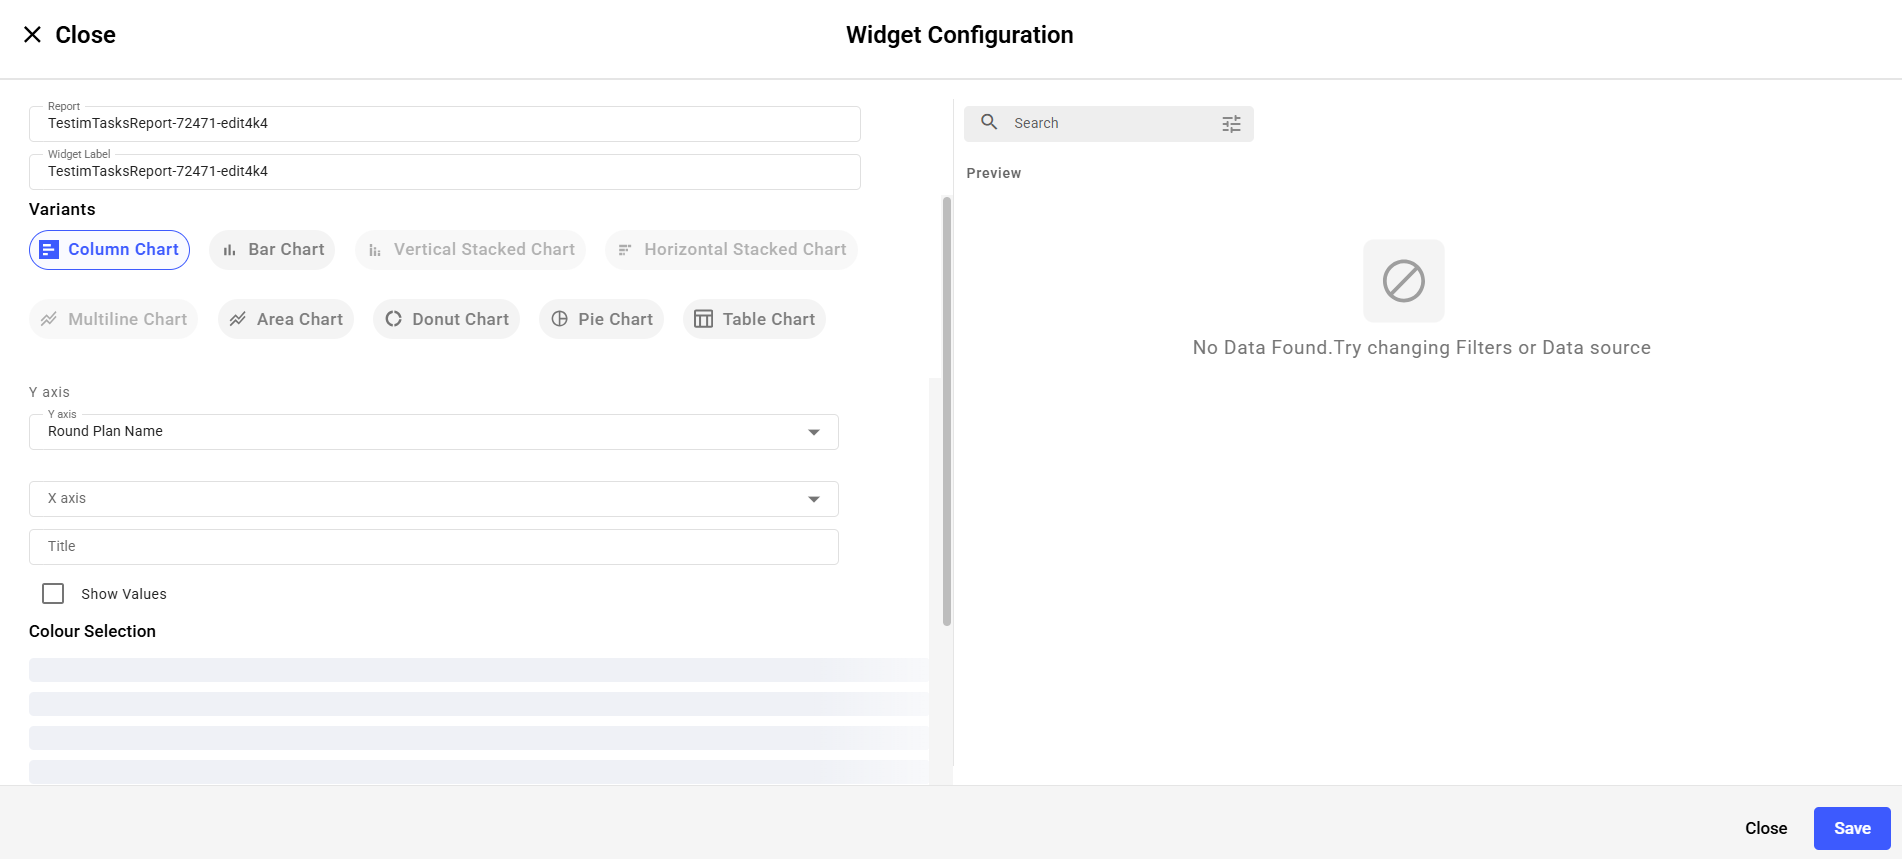
Provide below details in Widget Configuration screen:
- Select a Report.
- The Widget Label is auto-filled using the report name or update if a different label is required.
- Under Variants, select a chart type, such as:
- Column Chart
- Bar Chart
- Vertical Stacked Chart
- Horizontal Stacked Chart
- Multiline Chart
- Area Chart
- Donut Chart
- Pie Chart
- Table Chart
- Configure the axes
- Y axis: Select Shift Name or Shift ID from dropdown.
- X axis: Timestamp (default)
- Select display options “Show Values".
- Adjust Colour Selection for fills and legends.
- Review the live Preview panel.
- Click Save.
-
In the Dashboard screen, you can:
,
- Filter reports based on Last Day, Last Week, Last Month, Last 3 Months, Last 6 Months, or Custom.
- Filter reports based on Plant or Shift.
- Click the Restore
 icon to refresh the data in the
widget.
icon to refresh the data in the
widget. - Click the Save as Image
 icon to save the widget as an image.
 - Click the More
 icon and select Edit
to edit the widget.
icon and select Edit
to edit the widget. - Click the More icon and select Copy
to copy the widget.
- Click the More icon and select
Delete to delete the widget.
- Resize the widgets.
- Drag and drop widgets and change location.
- Click on the widget to see and download or export the detailed report in Excel format.
- Select the legend value in the widget to hide it from the widget (works only for Pie and Doughnut variants).