
Monitor Anomalies Using the Exceptions Dashboard
The Exceptions Dashboard helps you quickly identify and respond to issues that fall outside normal workflows or performance standards. It provides a real-time view of anomalies so you can take timely action before problems escalate.
The dashboard highlights critical exceptions, including:
- Overdue Work Orders: Identify work orders that were not completed within the scheduled time, and take immediate corrective action.
- Missed Deadlines: Flag rounds or tasks that were not executed as planned, and help maintain schedule adherence and accountability.
- Pending Approvals: Push the work items that need supervisor review, and ensure that approvals don’t become bottlenecks.
- Equipment Failures: Highlight reported asset failures that need urgent attention, and reduce unplanned downtime.
- Exceptions at Specific Locations or Assets: Detect location-specific or asset-specific anomalies to localize issues and prioritize resources accordingly.
This visibility allows you as a supervisor to take corrective actions, reassign tasks, and allocate resources more effectively — minimizing delays and improving operational efficiency across the facility.
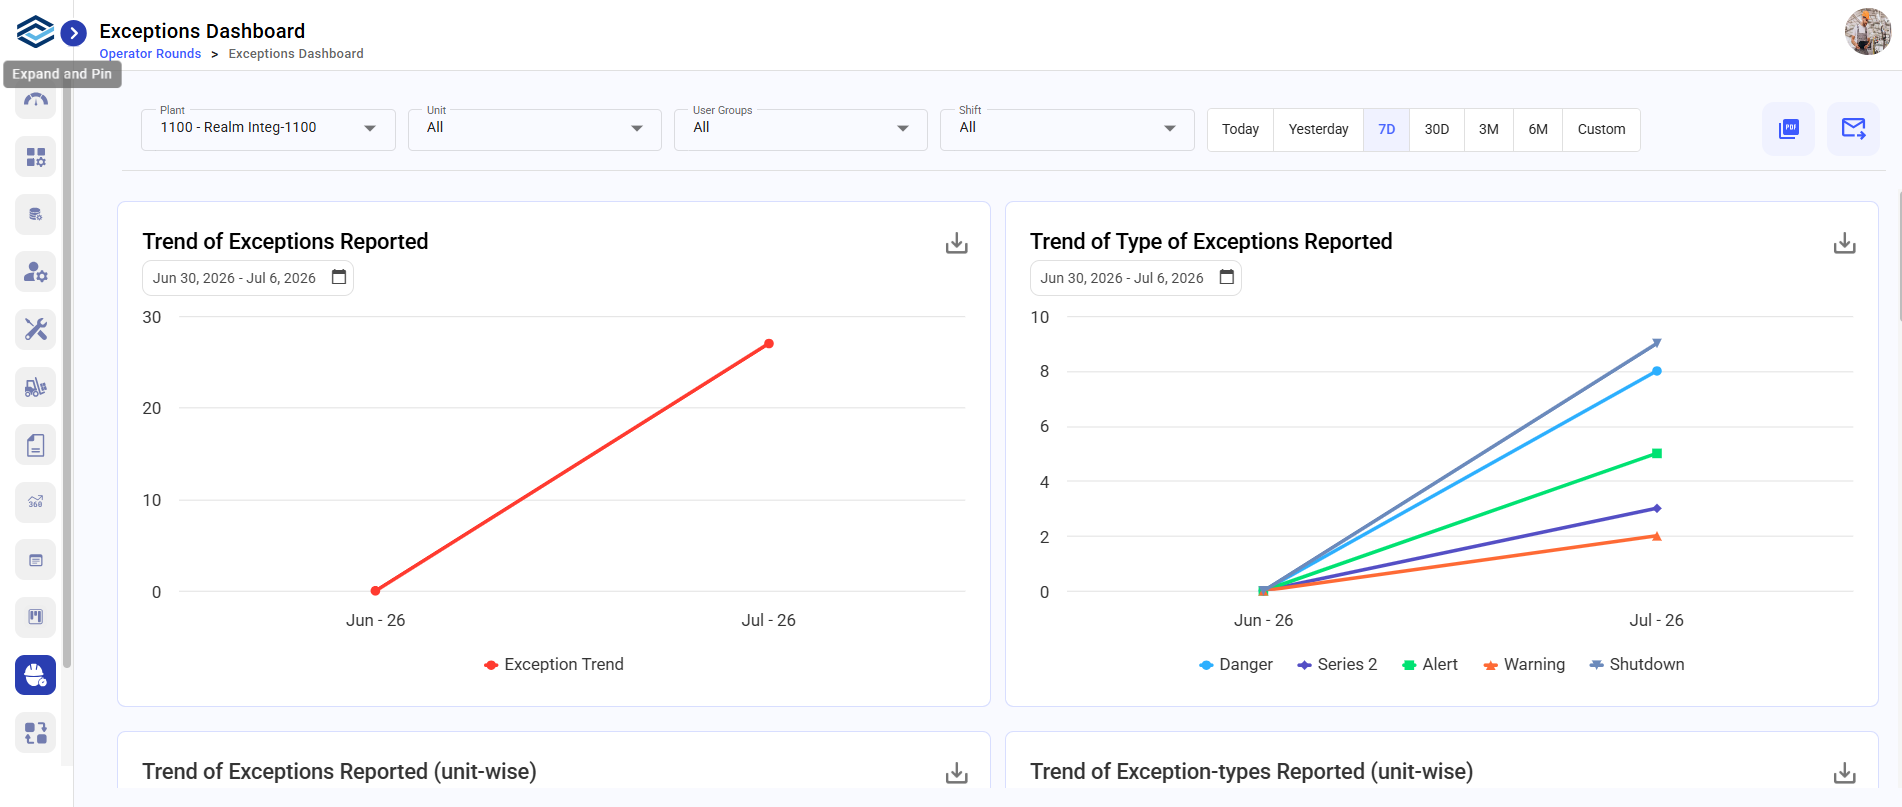
In this screen you can,
- Filter the reports based on Plant, Unit, Shift, User Group, Today, 7 Days, 30 Days, 3 Months, 6 Months, and Custom. The User Group filter is available only if User Groups are configured for your organization, and you can select one User Group at a time. If no User Group is selected, the dashboard displays data for all groups.
- Click the PDF icon on top-right to download the Exceptions Dashboard in PDF format.
- Click the Email icon on the top-right corner to share the dashboard through email.
- Click the Download icon on the report widget to save the report in image format.
- Click the values on the graph to view them in detail and download.