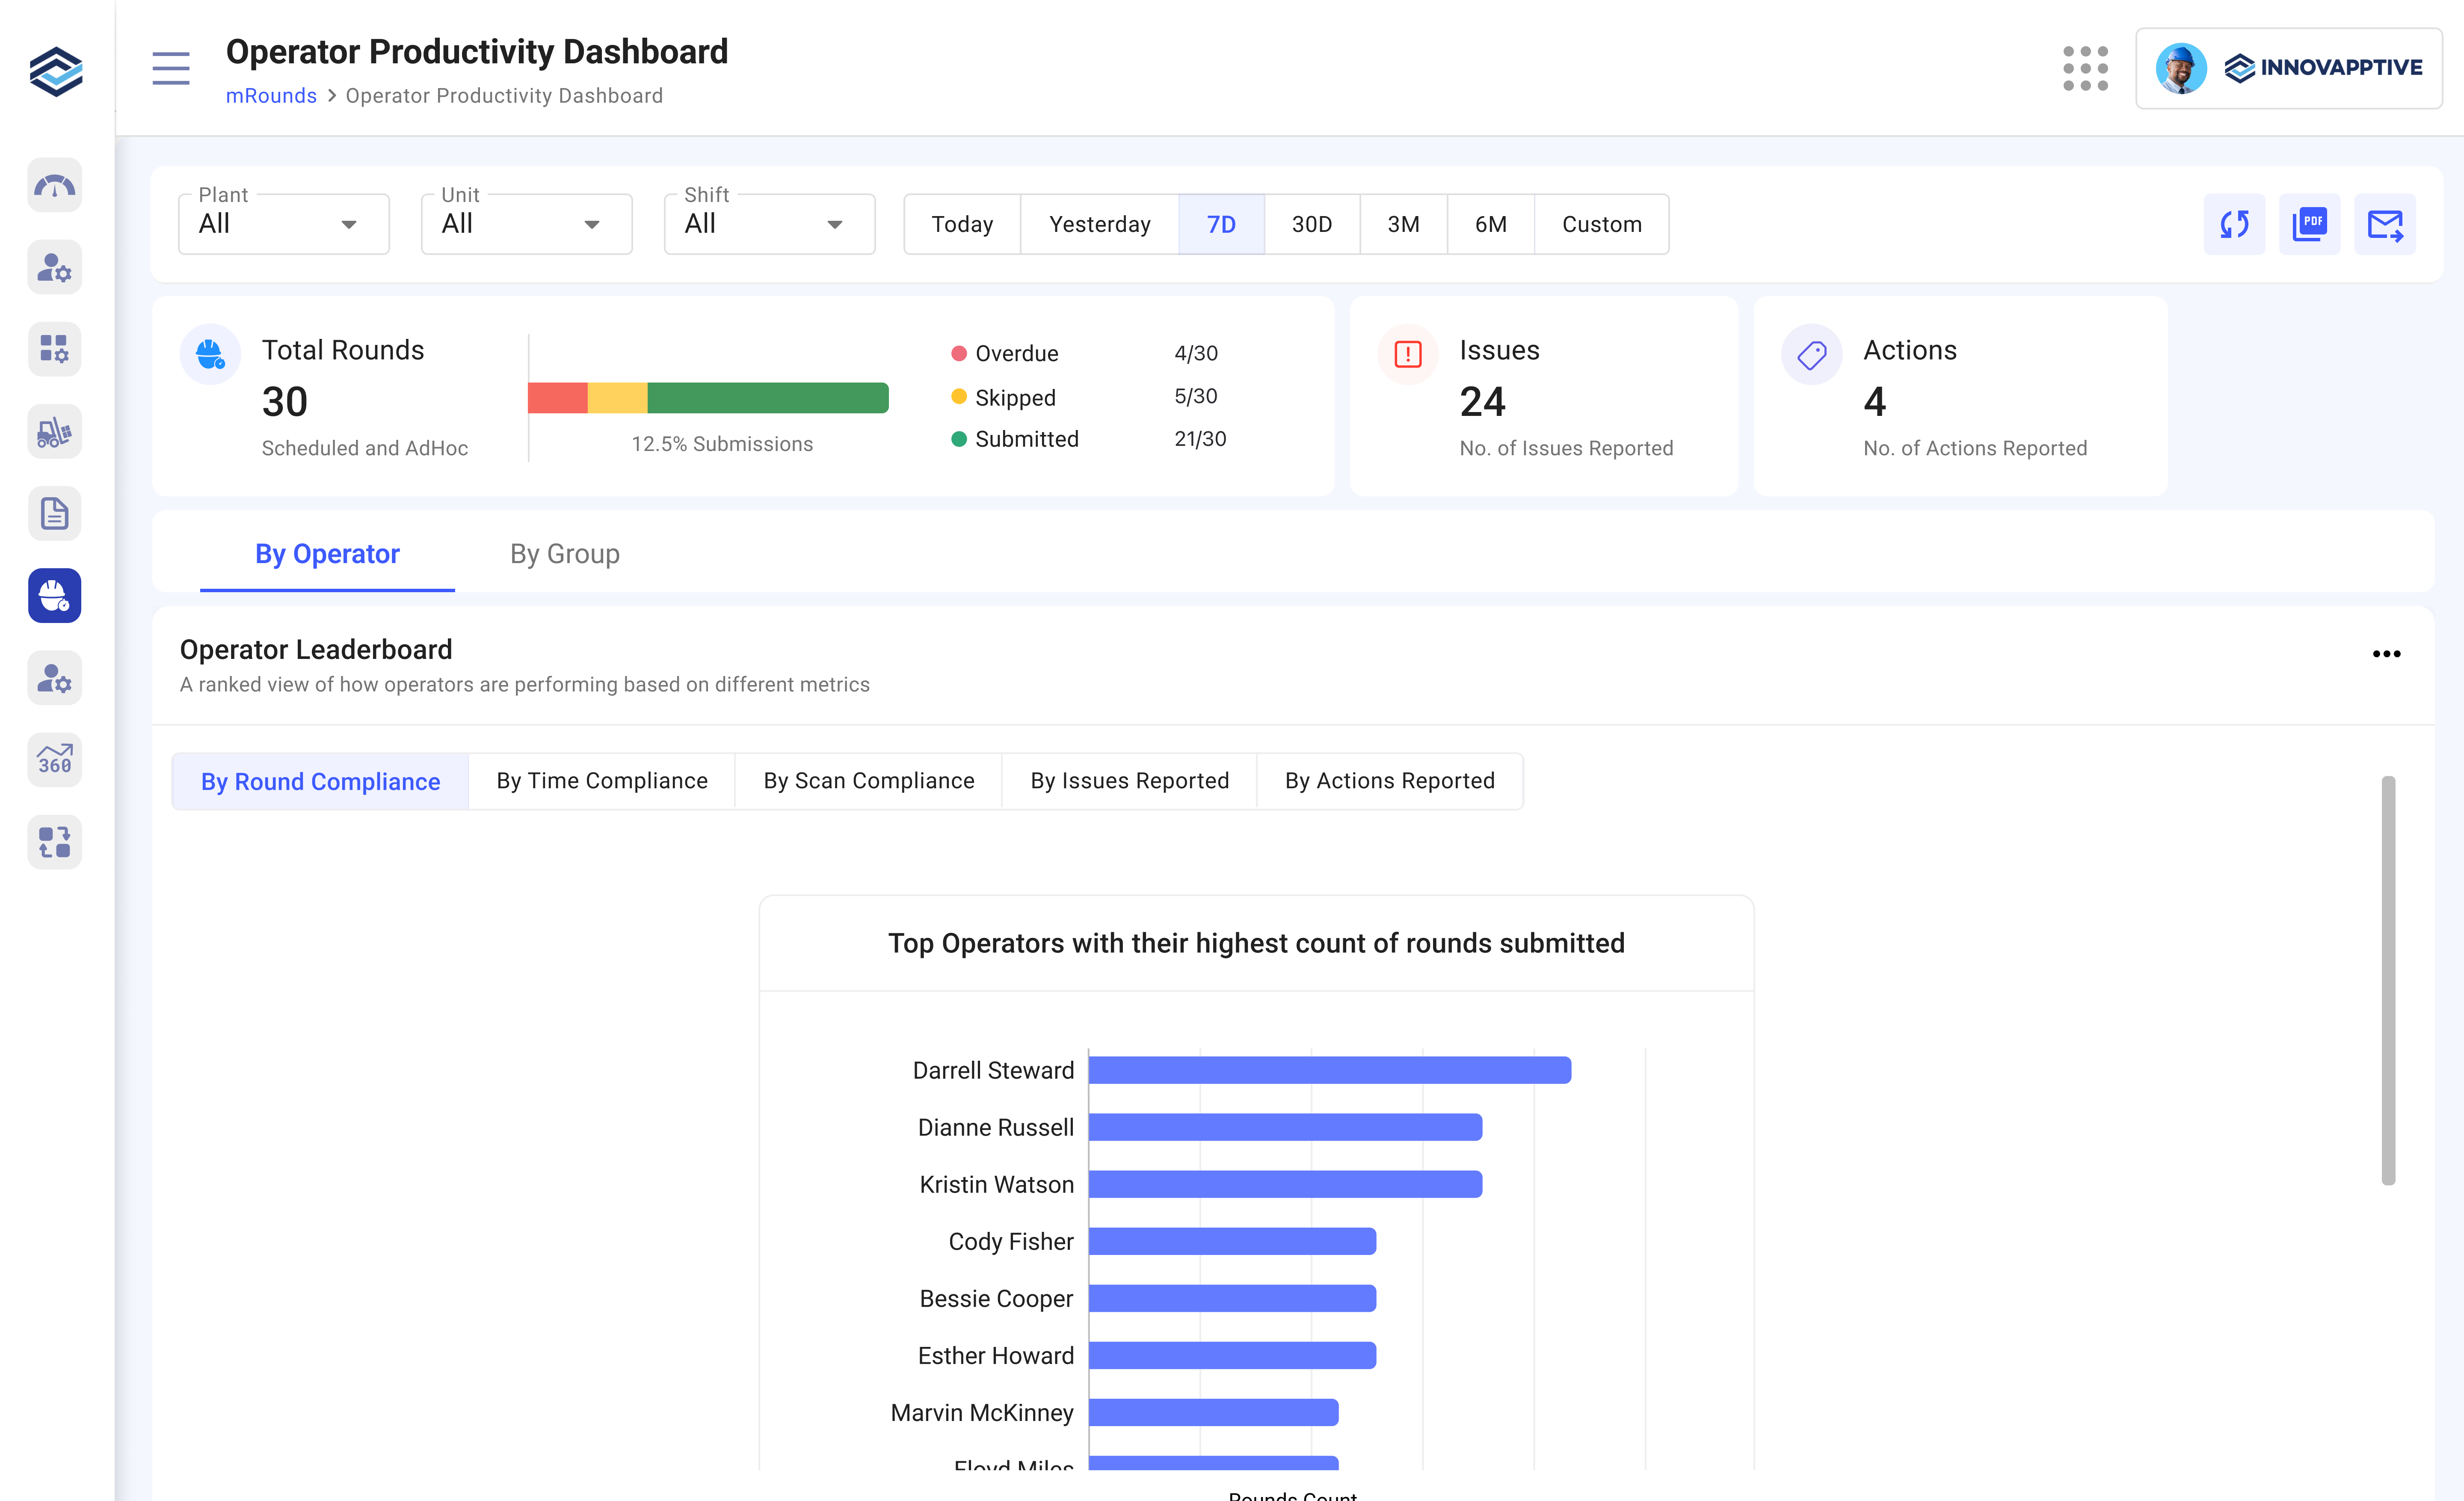
Operator Productivity Dashboard
The Operator Productivity Dashboard gives supervisors a clear, real-time view of how individual operators and user groups are performing. It tracks key metrics such as round compliance, issue reporting, and follow-up actions—making it easier to identify trends, spot gaps, and recognize top performers.
Built-in filters and drill-downs allows to analyze performance by Plant, Unit, Shift, and time range—such as Today, Last 7 Days, Last 30 Days, 3 Months, 6 Months, or a Custom period.
- Use the Search Bar to quickly find specific operators.
- Export performance data (PDF or Excel) using the download or Export Report buttons.
- Sort by column headers like Name, Compliance, or Assigned Rounds.
Key Performance Widgets
At the top of the dashboard, four widgets provide quick insights:
- Round Compliance – Shows how many rounds were completed vs. assigned, as both a count and a percentage.
- Non-Compliance – Highlights overdue rounds (missed deadlines) and skipped rounds.
- Issues – Displays the number of issues reported during rounds, helping prioritize maintenance and safety actions.
- Actions – Reflects the total follow-up actions recorded, such as corrective measures or maintenance requests.
The dashboard has two main tabs for deeper analysis: By Operator and By Group.
To view the Operator Productivity Dashboard:
- Expand the left side menu, navigate to mRounds, Operator Productivity Dashboard.
- Click By Operator, to view a breakdown of individual operator performance across multiple dimensions.
-
Click By Group, to view user group level performance and
assess team-wide productivity and issue handling.
Figure 1. Operator Productivity Dashboard