Add and Configure Widgets
Widgets visually represent operational data on your dashboard using charts, tables, or KPIs.
To add a widget:
- Navigate to Dashboard > My Dashboard.
- Navigate to the Mobile Dashboards section, open your custom dashboard, and click Add Widget.
-
Choose from:
- Pre-built Widgets: Ready-made visualizations that can be modified.
- Build Your Own Widget: Custom-built using your selected data fields.
If using Pre-built Widgets:- Select the module (e.g., iMaintenance.)
- Choose the object (e.g., Work Order, Issues.)
- Select data fields and click Add to Dashboard.
- (Optional) Modify the fields as needed.
If building your own widget:- Select Module and Object (e.g., Work Orders, Operations).
- Enter widget title and description.
- Set visualization options:
- Widget size: Small, Medium, Large.
- Chart types: Bar, Pie, Donut, Line, Column, Table, etc.
- Legend colors for visual clarity.
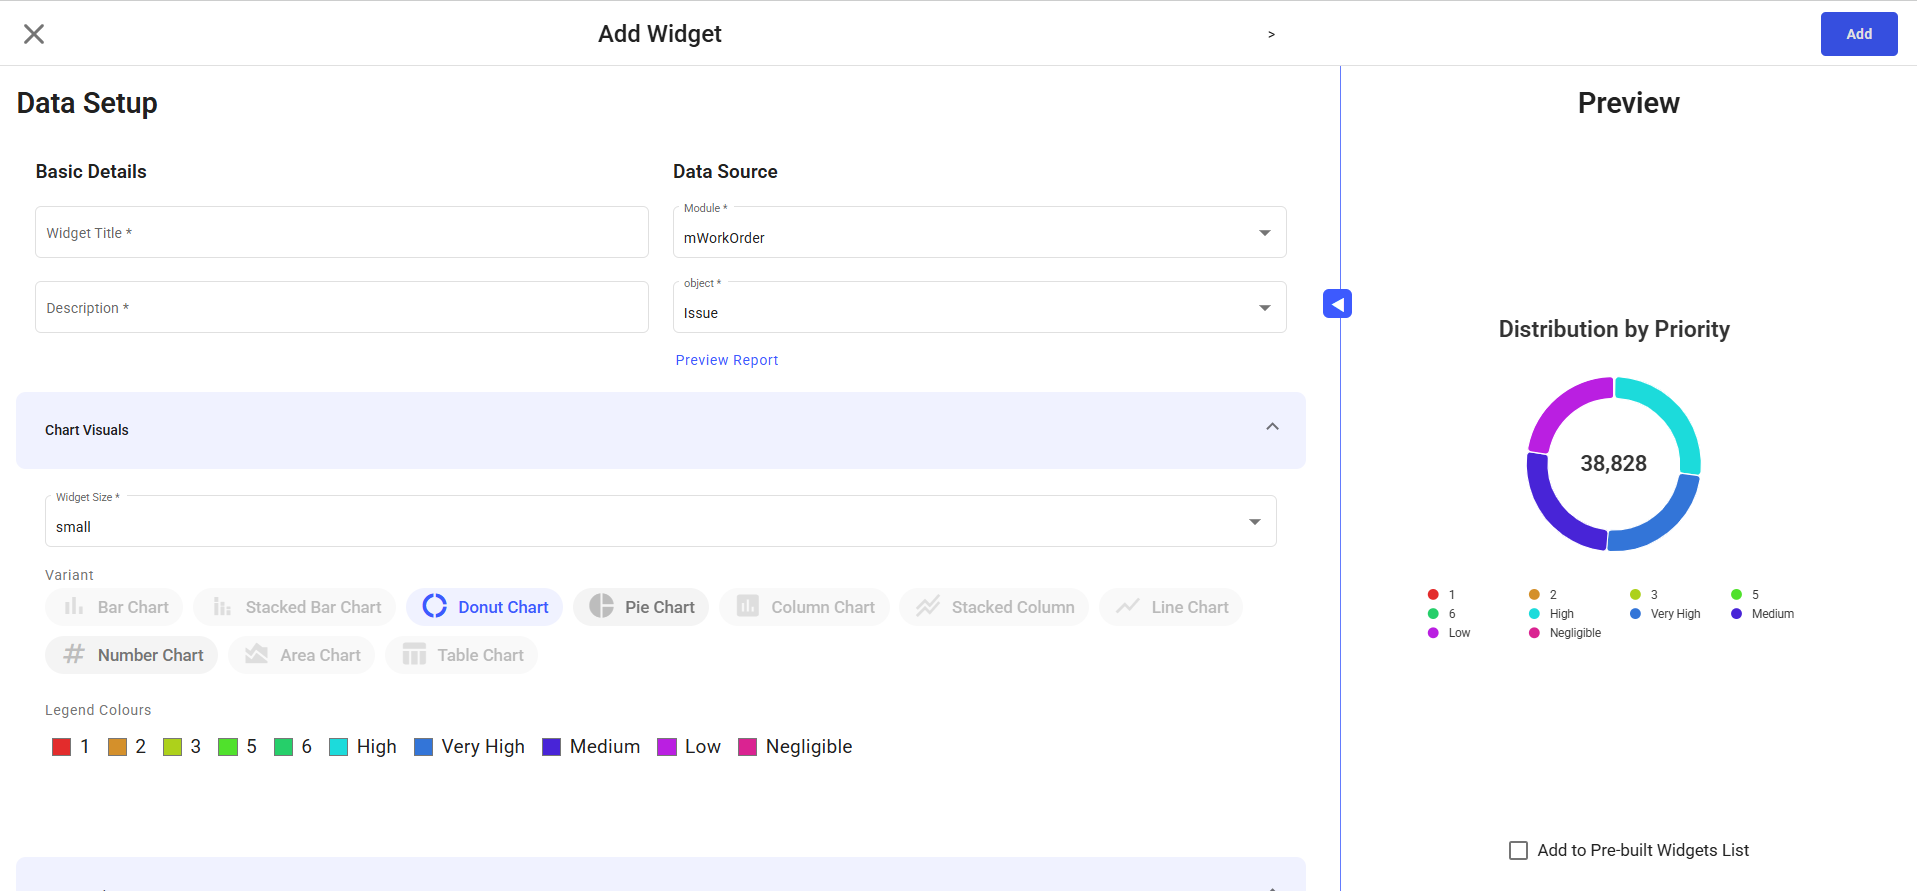
- Configure data:
- Data Settings: Define how data is sliced (e.g., by Priority).
- Data Filter: Apply filters like Priority, Assigned To Me, Created By Me.
- Preview the widget layout.
- Click Add to save the widget.