The Home (Dashboard) screen shows your assigned work orders, issues, and alerts in one place.
Technician Dashboard
After logging in, you'll see the Home screen—your main dashboard for managing
workload, tracking progress, and accessing key actions throughout your shift.
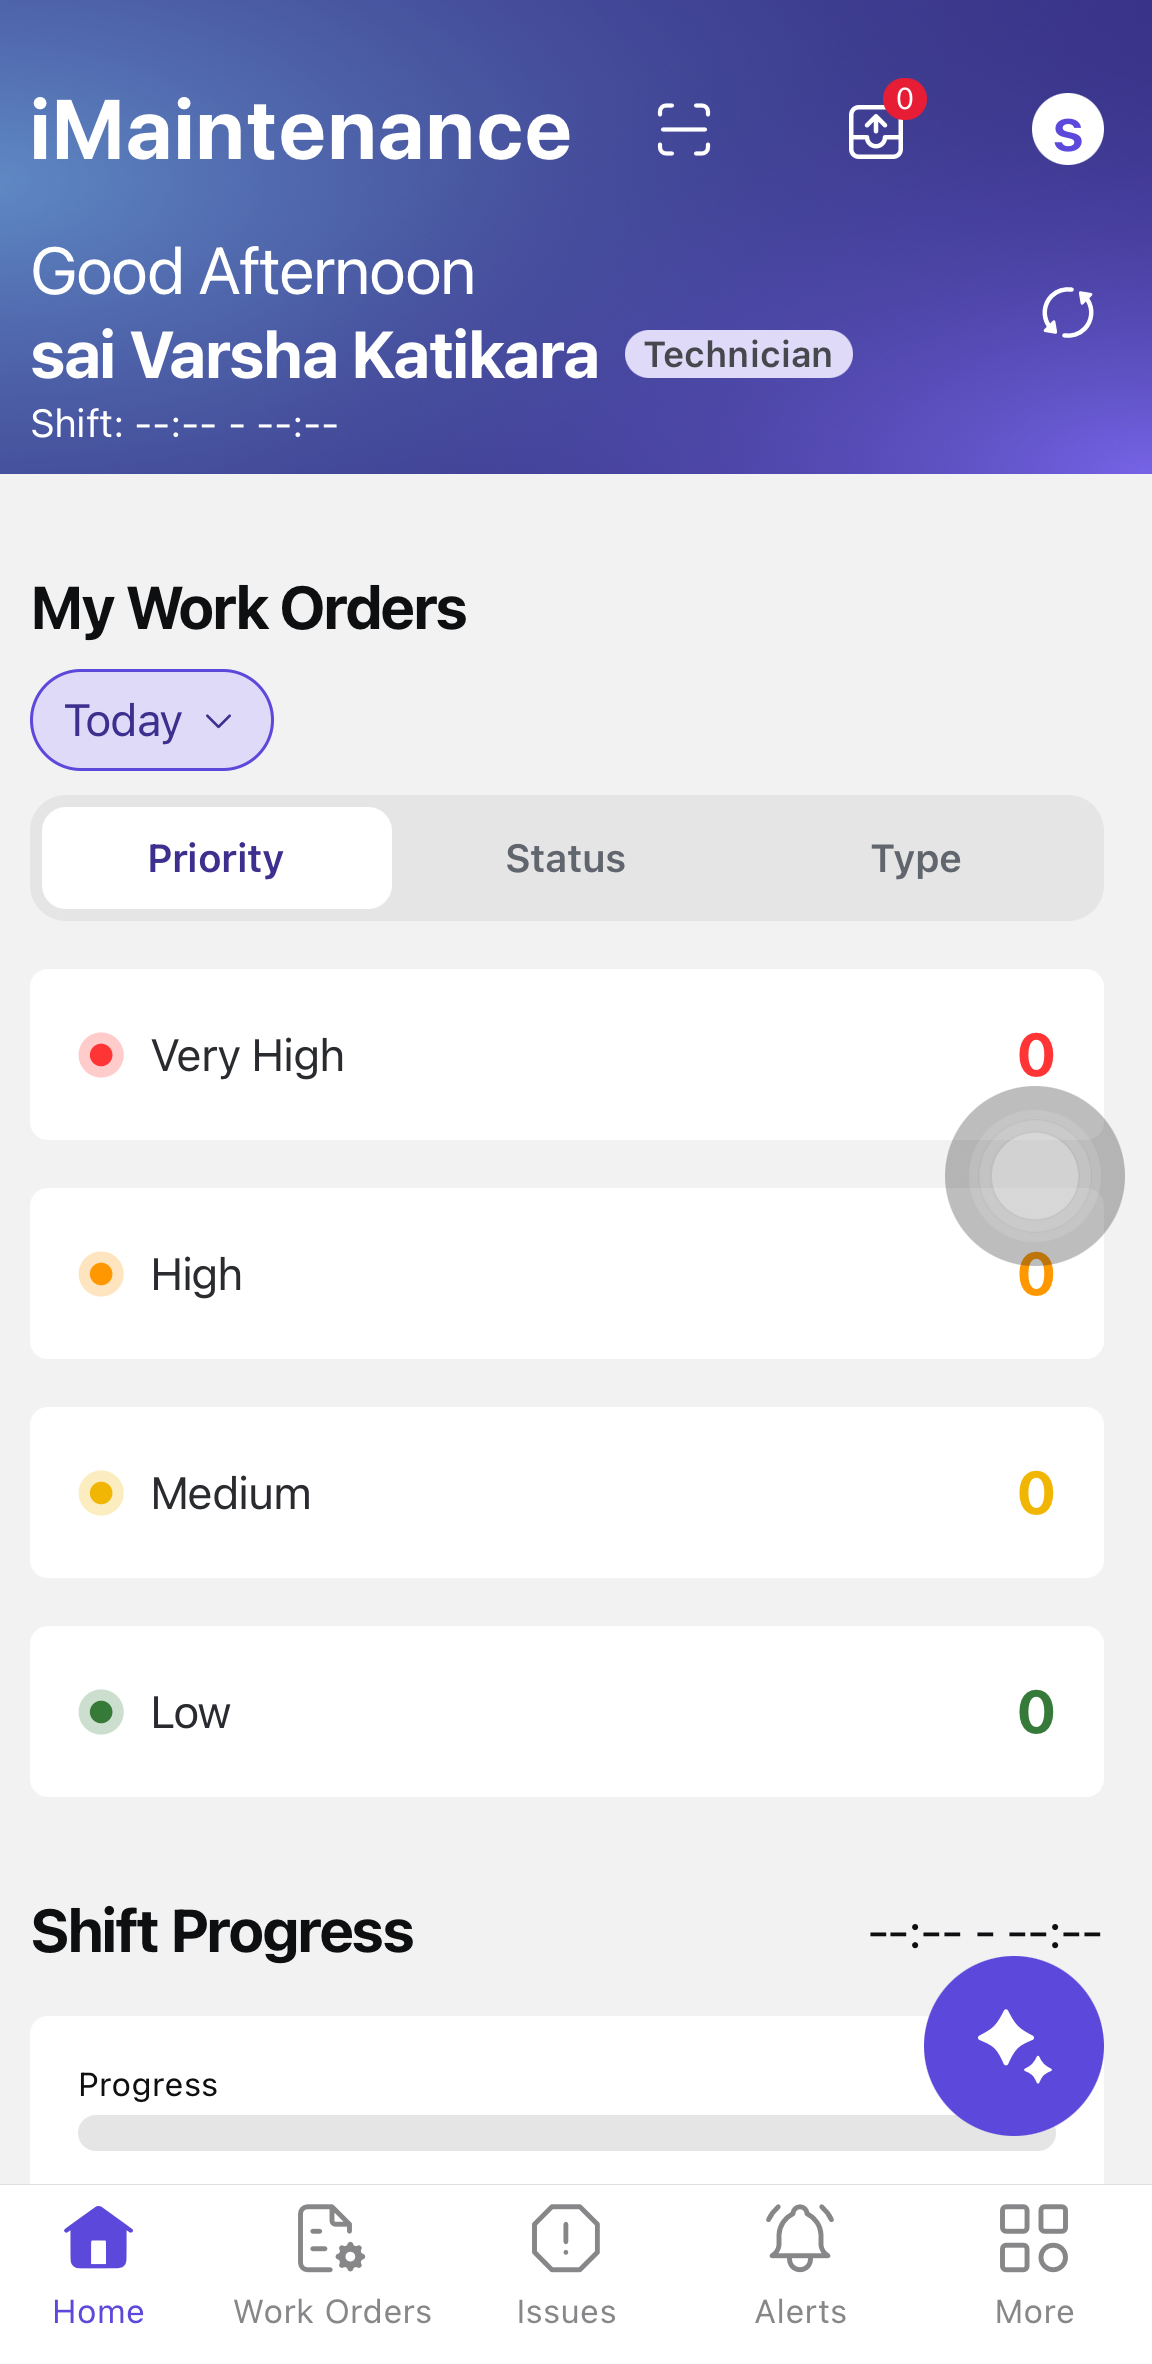
The Technician Dashboard is divided into the following key sections:Figure 1. Technician Dashboard
Tip:
Tap section headers (e.g., Work Orders, Issues) to
view filtered lists.
Header
Displays the greeting, name, current date, time, and shift details
(e.g., 07:00 AM – 03:00 PM).
The Scan
icon lets you scan the asset from the Dashboard.
The Outbox icon lets
you view pending records or the transactions that are done in
offline mode.
The Profile icon lets you view the
personal profile details.
The Manual Sync icon lets you manually
synchronize your device with the SAP backend. Use this whenever you
want to ensure your app is fully up to date.
You can apply filters to view data for:
Today (Default)
Tomorrow
This Week
Custom (specific date or date range)
My Work Orders
Select a category from the View by drop-down to display
interactive widgets that help you quickly identify and prioritize
pending tasks:
Priority: Displays work orders
grouped by priority levels — Very
High, High,
Medium, and
Low.
Status: Displays work orders grouped
by their current status — Created,
Released, In
Progress, Completed,
and Closed.
Type: Displays work orders grouped by
their type — Preventive WO,
Corrective WO,
Breakdown WO, and
Emergency WO.
Tap any category to open a filtered list of the corresponding work
orders.
Issues
This section displays the following three interactive widgets:
Priority: Displays issue grouped by
priority levels — Very High,
High,
Medium, and
Low.
Status: Displays issues grouped by
their current status — Open,
Released, In
Progress, Completed,
and Rejected.
Type: Displays issues grouped by
their type — Corrective and
Breakdown.
Tap any category to open a filtered list of the corresponding
issues.
Shift Progress
Shows a visual progress bar indicating the percentage of operations
completed for the selected time period (based on the applied
filter).
Live Status Overview
Shows technician activity with the following columns:
Planned Utilization: The total planned work for the
shift across all technicians.
Shift Progress: The total completed planned work for the shift,
alongside today’s operations progress
(completed/total).
Technician Name: The technician name with planned
hours.
Operation: The operation or job the technician is
currently working on, with a clickable link to open the full
work order details.
Operation Status: The status of the operation (In
Progress, On Hold, etc.).
Work Order: The work order the technician is
currently working on
Actions: Tap the Chat icon to start a conversation
with the technician.
Show All: Tap to view the status of all
technicians.
My Operations
Lists high-priority operations assigned to you, showing:
Priority levels
Permit and spare part readiness
AI-based assistance
Tap AI-Assistance to launch SIA (Smart In-App Assistant) and
view step summaries.
Tap Start to begin the task and trigger the auto-timer (if
permits and parts are already collected).
Note:
This section appears only if high-priority
tasks are assigned.
Preventive Maintenance Tasks
Displays PM work orders, if assigned, with due status (e.g., Due in
2 hours or Overdue).
Tap Start to launch the operation and begin auto-timer (if enabled).
If the timer isn’t enabled, manually update the task status to In
Progress.
Note:
This section is shown only when PM tasks
are assigned.
Issues Reported by Me
Lists all issues you’ve reported, grouped as:
Accepted
Rejected
Pending Review
Tap any category to open the Issues list with relevant filters
applied.
Note:
Header filters (Today, Tomorrow, This Week)
do not apply here.
Quick Actions
Provides shortcuts for the following frequently used actions:
Report an Issue
Create a Work Order
View Equipment List
View Functional Locations List
Fill Timesheets
Note:
The visibility and layout of dashboard widgets are RACE
configurable and may vary based on your organization’s configuration.

 icon lets you scan the asset from the Dashboard.
 icon lets
you view pending records or the transactions that are done in
offline mode.
icon lets
you view pending records or the transactions that are done in
offline mode. icon lets you view the
personal profile details.
icon lets you view the
personal profile details. icon lets you manually
synchronize your device with the SAP backend. Use this whenever you
want to ensure your app is fully up to date.
icon lets you manually
synchronize your device with the SAP backend. Use this whenever you
want to ensure your app is fully up to date.